-
Reefs at Risk Revisited (Social Vulnerability Data)
This shapefile features the Exclusive Economic Zones (EEZs) for 108 coral reef countries and territories classified according to an index of their reef dependence, adaptive capacity, and social vulnerability. Results are presented as quartiles, with 27 countries/territories classified in each of...
-
Reefs at Risk Revisited (Local Threats Data)
Threats from coastal development, marine-based pollution and damage, overfishing and destructive fishing, and watershed-based pollution were analyzed separately. These threats were integrated into the Integrated Local Threat index. Past thermal stress was integrated with local threats into the...
-
Reefs at Risk Revisited: Climate-Related Threats Data
Global (i.e., climate-related) threats to the world's coral reefs were analyzed. These include: past thermal stress (i.e., warming seas and bleaching over the last decade), future thermal stress (ie., projections of future warming in 2030 and 2050); and ocean acidification (i.e., reduced ocean...
-
Coral reefs in Kenya
This data was used in Map 6.4 and Map 6.5 in Nature's Benefits in Kenya: An Atlas of Ecosystems and Human Well-Being. The full report is available at http://www.geus.dk/program-areas/nature-environment/international/reports/kensea/kensea_rapport.pdf.
-
Marine Protected Areas in Coral Reef Regions of the World
This dataset is part of the base data used for Reefs at Risk Revisited. To assess the level of protection and management for coral reefs around the world. The map of MPAs and associated management effectiveness scores were used to adjust pressure from overfishing and destructive fishing in the...
-
Tropical Coral Reefs of the World (500-m resolution grid)
Global map of shallow, tropical coral reefs, gridded at 500-m resolution for use in the Reefs at Risk Revisited project. The coral reef location data were compiled from multiple sources by UNEP-WCMC, the WorldFish Center, and WRI. To standardize these data for the purposes of the Reefs at Risk...
-
Featured Aqueduct Global Flood Risk Maps
For the current scenario, we used hydrological data from 1960 through 1999 for generating flood inundations for 9 return periods, from 2-year flood to 1000-year flood, and 2010 GDP, population, and land use data for assessing flood impacts. For future projections, we used 5 GCMs (Global Climate...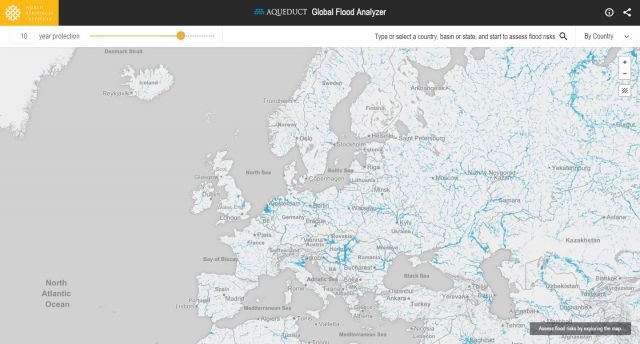
-
Aqueduct Global Flood Risk Country Rankings
Key Findings Approximately, 21 million people worldwide could be affected by river floods on average each year, and the 15 countries with the most people exposed, including India, Bangladesh, China, Vietnam, Pakistan, Indonesia, Egypt, Myanmar, Afghanistan, Nigeria, Brazil, Thailand, Democratic...
-
Global Map of Threat of Blast or Poison Fishing
This dataset was used as base data in Reefs at Risk. Map of blast and poison fishing (1 km grid) was developed for use in the Reefs at Risk Revisited project as a component of the model of overfishing and destructive fishing pressure on coral reefs. This layer designates threat of blast and...
-
Bleaching observations (1963-2010)
This dataset was used as base data in Reefs at Risk. Point locations of reported observations of coral bleaching between 1963 and 2010. This dataset was built upon an original bleaching database developed at UNEP-WCMC, and has been maintained and updated regularly by ReefBase since early 2002.
-
Shipping Activity
This dataset was used as base data in Reefs at Risk. Shipping activity data used in the model of threat to coral reefs from marine-based pollution and damage in the Reefs at Risk Revisited project. This dataset was derived at WRI from the World Meteorological Organization Voluntary Observing...
-
Aqueduct Global Maps 2.0
Companies can use this information to prioritize actions, investors to leverage financial interest to improve water management, and governments to engage with the private sector to seek solutions for more equitable and sustainable water governance. Aqueduct Global Maps 2.0 includes indicators of...
-
Featured Aqueduct Global Maps 2.1 Data
Awareness around the physical, regulatory, and reputational water risks to companies and their investors is on the rise and robust, comparable and comprehensive data is needed to help assess these water-related risks. In response to this demand, the World Resources Institute developed the...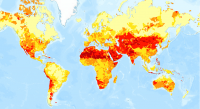
-
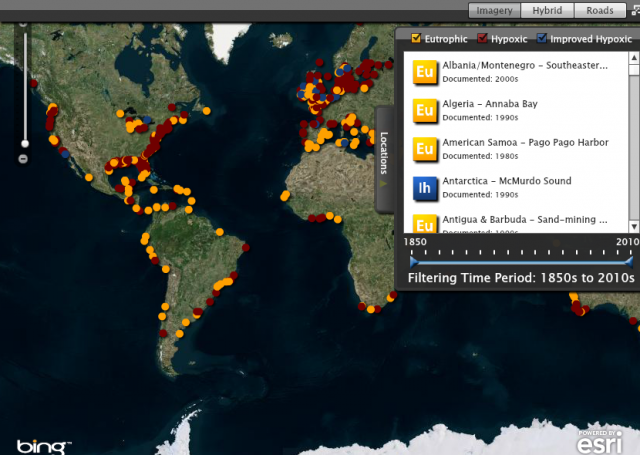
Eutrophication & Hypoxia Map Data Set
The Interactive Map of Eutrophication & Hypoxia represents 762 coastal areas impacted by eutrophication and/or hypoxia. There are 479 sites identified as experiencing hypoxia, 55 sites that once experienced hypoxia but are now improving, and 228 sites that experience other symptoms of...