-
Percent of Land under Cultivation in Kenya
Used in Map 5.4 of Nature's Benefits in Kenya: An Atlas of Ecosystems and Human Well-Being.Original data are downloadable at www.africover.org.
-
CAIT - Country Clean Technology Data
This collection emerges from a collaboration of five leading research institutions: World Resources Institute (WRI), Institute for Global Environmental Strategies (IGES), Öko Institut, Renmin University, and The Energy and Resources Institute (TERI), based in the target countries. Researchers at...
-
Eutrophication & Hypoxia Map Data Set
The Interactive Map of Eutrophication & Hypoxia represents 762 coastal areas impacted by eutrophication and/or hypoxia. There are 479 sites identified as experiencing hypoxia, 55 sites that once experienced hypoxia but are now improving, and 228 sites that experience other symptoms of...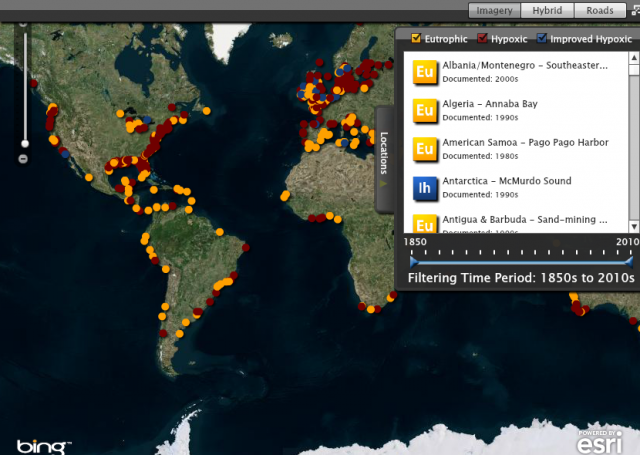
-
Percent woodlots in sampled cropland in Kenya
This data was used in Map 7.3 in Nature's Benefits in Kenya: An Atlas of Ecosystems and Human Well-Being. These data combine detailed crop information from 5,747 aerial photos for a growing season in 1997, each providing a sample point of detailed crop information. These samples were averaged...
-
Percentage Food Crops in Central and Western Kenya
World Agroforestry Center (ICRAF) and Department of Resource Surveys and Remote Sensing (DRSRS), Ministry of Environment and Natural Resources. 2001. GIS Database of Land Use and Land Cover for Kenya's Medium to High Potential Districts. DRSRS interpretation of 5,747 aerial photographs from...
-
Average number of crops grown in croplands of central and western Kenya, 1997
World Agroforestry Center (ICRAF) and Department of Resource Surveys and Remote Sensing (DRSRS), Ministry of Environment and Natural Resources. 2001. GIS Database of Land Use and Land Cover for Kenya's Medium to High Potential Districts. DRSRS interpretation of 5,747 aerial photographs from...
-
Tourist Accommodations in Kenya
Approximately placed by ILRI/WRI based on MacMillan Education Ltd. 1993, UNEP/GRID-Nairobi 1998, and RoK 1998
-
Number of beds by hotel on the eastern coast of Kenya
Number of beds calculated by ILRI and WRI, based on RoK 2003 and UNEP 1998. This data was used in Map 6.4 and Map 6.5 in Nature's Benefits in Kenya: An Atlas of Ecosystems and Human Well-Being.
-
Locations of mangroves in Kenya (line)
This data was used in Map 6.4 and Map 6.5 in Nature's Benefits in Kenya: An Atlas of Ecosystems and Human Well-Being. The full report is available at http://www.geus.dk/program-areas/nature-environment/international/reports/kensea/kensea_rapport.pdf.
-
Locations of mangroves in Kenya (polygon)
This data was used in Map 6.4 and Map 6.5 in Nature's Benefits in Kenya: An Atlas of Ecosystems and Human Well-Being. The full report is available at http://www.geus.dk/program-areas/nature-environment/international/reports/kensea/kensea_rapport.pdf.
-
Turtle nesting and breeding sites in Kenya
This data was used in Map 6.4 and Map 6.5 in Nature's Benefits in Kenya: An Atlas of Ecosystems and Human Well-Being. The full report is available at http://www.geus.dk/program-areas/nature-environment/international/reports/kensea/kensea_rapport.pdf.
-
Kenya Important Bird Areas (IBAs) and their Status, 2003-04
This data was used in Map 5.3 in Nature's Benefits in Kenya: An Atlas of Ecosystems and Human Well-Being. Please note that this data is frequently updated. Please refer to Birdlife International's website for most updated versions and downloads: http://www.birdlife.org/datazone/index.html
-
Endemic Bird Areas (EBAs) in Kenya
This data was used in Map 5.3 in Nature's Benefits in Kenya: An Atlas of Ecosystems and Human Well-Being. Please note that this data is frequently updated. Please refer to Birdlife International's website for most updated versions and downloads: http://www.birdlife.org/datazone/index.html
-
Dugong Sites and Dolphin Schools on the Eastern Coast of Kenya
This data was used in Map 6.4 and Map 6.5 in Nature's Benefits in Kenya: An Atlas of Ecosystems and Human Well-Being. Original report and data available on http://www.unep.org/eafatlas/dbke.htm
-
CAIT - Countries' Pre-2020 Climate Pledges submitted to the UNFCCC
The structured data from the CAIT Pre-2020 Pledges Map enables users to explore, compare, and assess climate change mitigation pledges submitted by Parties to the United Nations Framework Convention on Climate Change (UNFCCC) in 2009 and 2010. The information related to quantified economy-wide...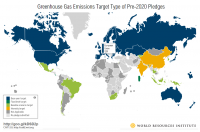
-
Average water consumption of livestock and wildlife by sub-basin in Kenya, 19...
WRI/ILRI calculation based on animal data from DRSRS 2003; Grunblatt et al. 1995, 1996; and daily water requirements for selected species from MoWD and JICA 1992, Peden at al. 2003, 2004. This data was used in Map 3.13 in Nature's Benefits in Kenya: An Atlas of Ecosystems and Human Well-Being.
-
Annual Growth of Biomass and Theoretically Harvestable Biomass Yield outside ...
This data was used in Map 7.6 and Map 7.7 in Nature's Benefits in Kenya: An Atlas of Ecosystems and Human Well-Being. Values of zero for both fields pertain to croplands and urban areas, and should be displayed as ""not applicable."" Note: All areas classified as 'natural and semi-natural' in...
-
Kenya Shaded Relief Surface (90m resolution)
The cell values represent illumination value from 0 - 255. Shaded relief surfaces are mainly used as background in mapping and displaying data. [RETURN] This spatial data set is a derivative product of the Shuttle Radar Topography Mission(SRTM) digital elevation model(DEM) data set. The SRTM DEM...
-
Wildlife density in Kenya's rangelands, 1977-78
This data was used in Map 5.10 in Nature's Benefits in Kenya: An Atlas of Ecosystems and Human Well-Being. Species numbers were aggregated using a ""tropical livestock unit"" (TLU) (which is equivalent to an animal weight of 250 kilograms) to grid cells of 5x5 km and then averaged by square...
-
Change in wildlife density in Kenya's rangelands between 1977-78 and 1994-96
This data was used in Map 5.12 in Nature's Benefits in Kenya: An Atlas of Ecosystems and Human Well-Being. Species numbers were aggregated using a ""tropical livestock unit"" (TLU) (which is equivalent to an animal weight of 250 kilograms) to grid cells of 10x10 km and then averaged by square...