-
Aqueduct Global Maps 2.0
Companies can use this information to prioritize actions, investors to leverage financial interest to improve water management, and governments to engage with the private sector to seek solutions for more equitable and sustainable water governance. Aqueduct Global Maps 2.0 includes indicators of...
-
Land Use in Selected Indian Cities
The dataset comprises eleven series of land use/land cover (LULC) maps, each corresponding to one city in India—Ahmedabad, Belgaum, Hindupur, Hyderabad, Jalna, Kanpur, Parbhani, Pune, Singrauli, Sitapur, or Vijayawada—and containing one map per year for 2015–2018. Every map contains several...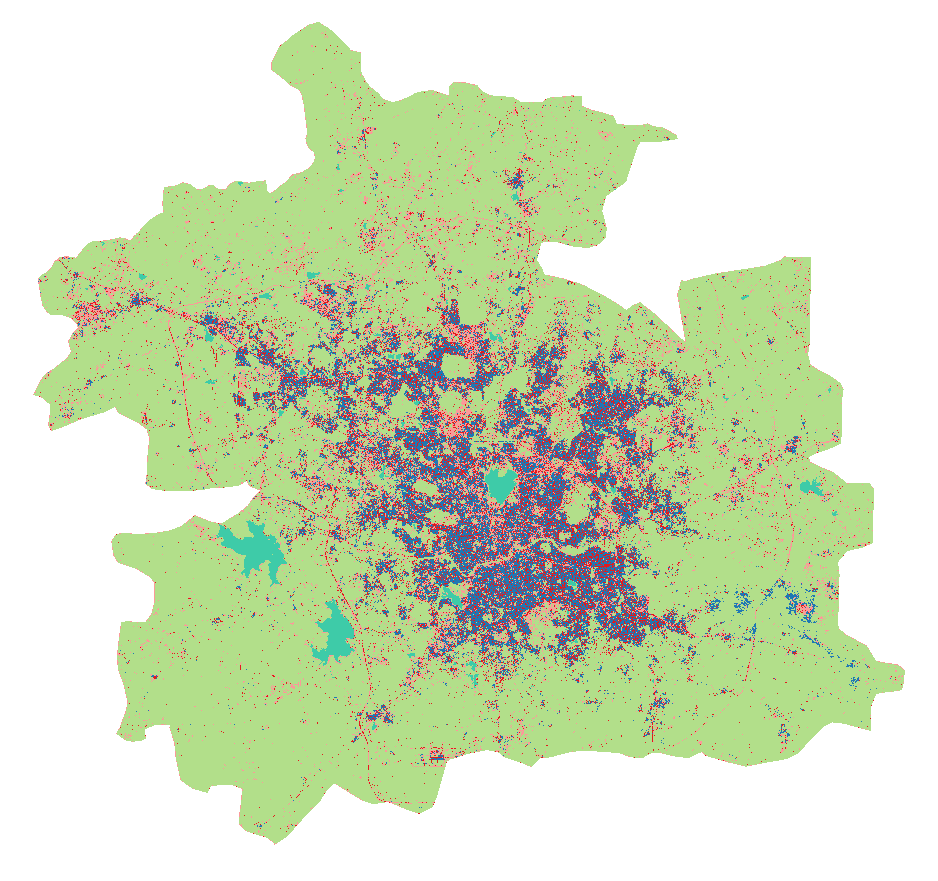
-
Urban areas in Kenya
This data was used in Map 1.3 and in other maps throughout Nature's Benefits in Kenya: An Atlas of Ecosystems and Human Well-Being. Original data are downloadable at www.africover.org.
-
Índice de Desigualdad Urbana (Index of Urban Inequality)
The main objective of the UII methodology is to estimate the level of accessibility/proximity to urban equipment for different socioeconomic strata in cities. This allows to compare and identify inequality in the territorial distribution of development opportunities such as formal employment,...
FORMATS: -
Uganda Rural Poverty Data 2005
The poverty indicators produced by the Uganda Bureau of Statistics (UBOS) are based on household consumption expenditures, including both food and a range of nonfood items such as education, transport, health, and rent. Households are defined as poor when their total expenditures fall below...
-
Percent of Land under Cultivation in Kenya
Used in Map 5.4 of Nature's Benefits in Kenya: An Atlas of Ecosystems and Human Well-Being.Original data are downloadable at www.africover.org.
-
Locations of water supplies serving Nairobi, Kenya.
Locations of dam were approximately located by WRI based on SoK 1971, MoWD and JICA 1992a, 1992b, 1992c, Nyaoro 1999, and Wambua 2003. This data was used in Map 3.9 in Nature's Benefits in Kenya: An Atlas of Ecosystems and Human Well-Being.
-
China Overseas Finance Inventory Database
The COFI database includes power-generation projects in Belt and Road Initiative (BRI) countries financed by Chinese corporations and banks that reached financial closure from 2000 to 2023. Types of financing include debt and equity investment, with the latter including greenfield foreign direct...
-
Datasheet for Technical Note: A Breakdown of Developed Countries’ Public Clim...
This dataset contains a breakdown of developed countries individual public contributions in public climate finance towards the $100 billion commitment between 2013-2018. This dataset was used in WRI’s technical note ‘A Breakdown of Developed Countries’ Public Climate Finance Contributions Towards...
-
Featured Aqueduct Global Flood Risk Maps
For the current scenario, we used hydrological data from 1960 through 1999 for generating flood inundations for 9 return periods, from 2-year flood to 1000-year flood, and 2010 GDP, population, and land use data for assessing flood impacts. For future projections, we used 5 GCMs (Global Climate...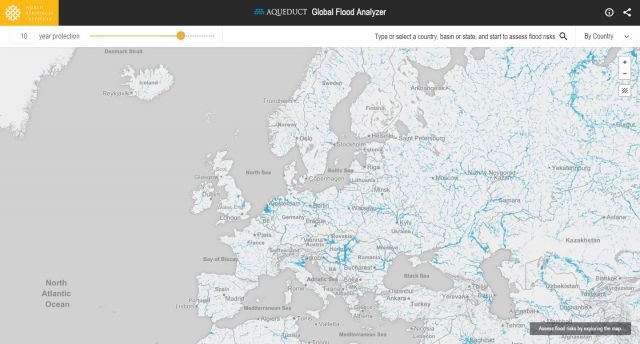
-
Average water consumption of livestock and wildlife by sub-basin in Kenya, 19...
WRI/ILRI calculation based on animal data from DRSRS 2003; Grunblatt et al. 1995, 1996; and daily water requirements for selected species from MoWD and JICA 1992, Peden at al. 2003, 2004. This data was used in Map 3.13 in Nature's Benefits in Kenya: An Atlas of Ecosystems and Human Well-Being.
-
WRI Ross Center for Sustainable Cities’ Water and Sanitation 15-City Study
To address the absence of comparable city-level water data, this dataset compiles data from 15 global South cities located in sub-Saharan Africa, South Asia, and Latin America and among the regions that are the focus of the World Resources Report (WRR) "Towards a More Equal City". The 15 cities...
-
Marine Protected Areas in Coral Reef Regions of the World
This dataset is part of the base data used for Reefs at Risk Revisited. To assess the level of protection and management for coral reefs around the world. The map of MPAs and associated management effectiveness scores were used to adjust pressure from overfishing and destructive fishing in the...
-
CAIT Indonesia Climate Data Explorer (PINDAI) Data
The data set draws primarily from Local Action Plan for Greenhouse Gas Emission Reduction (RAD GRK), and Medium Term Local Development Plans (RPJMD) of each province in Indonesia. These documents are obtained from Indonesian national and regional government agencies, including the Secretariat of...
-
Annual Growth of Biomass and Theoretically Harvestable Biomass Yield outside ...
This data was used in Map 7.6 and Map 7.7 in Nature's Benefits in Kenya: An Atlas of Ecosystems and Human Well-Being. Values of zero for both fields pertain to croplands and urban areas, and should be displayed as ""not applicable."" Note: All areas classified as 'natural and semi-natural' in...
-
NWIS 1997 Data (Uganda)
Some data were used in maps 4, 5, 6, 7, 8, 9, 10 of ""Mapping a Better Future: How Spatial Analysis Can Benefit Wetlands and Reduce Poverty in Uganda."" from Wetlands Management Department, Ministry of Water and Environment, Uganda; Uganda Bureau of Statistics; International Livestock Research...
-
Uganda Safe Water Coverage
Rural safe water coverage as defined by the Directorate of Water Development, Ministry of Water and Environment, Uganda. Data used in maps 3, 4, 5, 6 of ""Mapping a Healthier Future: How Spatial Analysis Can Guide Pro-Poor Water and Sanitation Planning in Uganda."" from Health Planning...
-
Percent woodlots in sampled cropland in Kenya
This data was used in Map 7.3 in Nature's Benefits in Kenya: An Atlas of Ecosystems and Human Well-Being. These data combine detailed crop information from 5,747 aerial photos for a growing season in 1997, each providing a sample point of detailed crop information. These samples were averaged...
-
Percentage Food Crops in Central and Western Kenya
World Agroforestry Center (ICRAF) and Department of Resource Surveys and Remote Sensing (DRSRS), Ministry of Environment and Natural Resources. 2001. GIS Database of Land Use and Land Cover for Kenya's Medium to High Potential Districts. DRSRS interpretation of 5,747 aerial photographs from...
-
Average number of crops grown in croplands of central and western Kenya, 1997
World Agroforestry Center (ICRAF) and Department of Resource Surveys and Remote Sensing (DRSRS), Ministry of Environment and Natural Resources. 2001. GIS Database of Land Use and Land Cover for Kenya's Medium to High Potential Districts. DRSRS interpretation of 5,747 aerial photographs from...