-
Aqueduct Global Maps 2.0
Companies can use this information to prioritize actions, investors to leverage financial interest to improve water management, and governments to engage with the private sector to seek solutions for more equitable and sustainable water governance. Aqueduct Global Maps 2.0 includes indicators of...
-
Featured Rights to Resources
The data included in this spreadsheet were downloaded from the World Resource Institute's Rights to Resources interactive map. The Rights to Resources interactive map presents the results of a legal review of national laws in sub-Saharan Africa in their treatment of local-use rights to natural...
-
World's Average Monthly Rainfall in November
This data was used in Map 3.5 in Nature's Benefits in Kenya: An Atlas of Ecosystems and Human Well-Being.
-
World's Average Monthly Rainfall in July
This data was used in Map 3.4 in Nature's Benefits in Kenya: An Atlas of Ecosystems and Human Well-Being.
-
World's Average Monthly Rainfall in April
This data was used in Map 3.3 in Nature's Benefits in Kenya: An Atlas of Ecosystems and Human Well-Being.
-
World's average monthly rainfall in February
This data was used in Map 3.2 in Nature's Benefits in Kenya: An Atlas of Ecosystems and Human Well-Being.
-
Marine Protected Areas in Coral Reef Regions of the World
This dataset is part of the base data used for Reefs at Risk Revisited. To assess the level of protection and management for coral reefs around the world. The map of MPAs and associated management effectiveness scores were used to adjust pressure from overfishing and destructive fishing in the...
-
Tropical Coral Reefs of the World (500-m resolution grid)
Global map of shallow, tropical coral reefs, gridded at 500-m resolution for use in the Reefs at Risk Revisited project. The coral reef location data were compiled from multiple sources by UNEP-WCMC, the WorldFish Center, and WRI. To standardize these data for the purposes of the Reefs at Risk...
-
Datasheet for Technical Note: A Breakdown of Developed Countries’ Public Clim...
This dataset contains a breakdown of developed countries individual public contributions in public climate finance towards the $100 billion commitment between 2013-2018. This dataset was used in WRI’s technical note ‘A Breakdown of Developed Countries’ Public Climate Finance Contributions Towards...
-
Locations of water supplies serving Nairobi, Kenya.
Locations of dam were approximately located by WRI based on SoK 1971, MoWD and JICA 1992a, 1992b, 1992c, Nyaoro 1999, and Wambua 2003. This data was used in Map 3.9 in Nature's Benefits in Kenya: An Atlas of Ecosystems and Human Well-Being.
-
Índice de Desigualdad Urbana (Index of Urban Inequality)
The main objective of the UII methodology is to estimate the level of accessibility/proximity to urban equipment for different socioeconomic strata in cities. This allows to compare and identify inequality in the territorial distribution of development opportunities such as formal employment,...
FORMATS: -
China Overseas Finance Inventory Database
The COFI database includes power-generation projects in Belt and Road Initiative (BRI) countries financed by Chinese corporations and banks that reached financial closure from 2000 to 2023. Types of financing include debt and equity investment, with the latter including greenfield foreign direct...
-
Average water consumption of livestock and wildlife by sub-basin in Kenya, 19...
WRI/ILRI calculation based on animal data from DRSRS 2003; Grunblatt et al. 1995, 1996; and daily water requirements for selected species from MoWD and JICA 1992, Peden at al. 2003, 2004. This data was used in Map 3.13 in Nature's Benefits in Kenya: An Atlas of Ecosystems and Human Well-Being.
-
Uganda Rural Poverty Data 2005
The poverty indicators produced by the Uganda Bureau of Statistics (UBOS) are based on household consumption expenditures, including both food and a range of nonfood items such as education, transport, health, and rent. Households are defined as poor when their total expenditures fall below...
-
CAIT Indonesia Climate Data Explorer (PINDAI) Data
The data set draws primarily from Local Action Plan for Greenhouse Gas Emission Reduction (RAD GRK), and Medium Term Local Development Plans (RPJMD) of each province in Indonesia. These documents are obtained from Indonesian national and regional government agencies, including the Secretariat of...
-
Indicators of Sustainable Agriculture: A Scoping Analysis
The spreadsheet “Evaluation of Candidate Indicators of Environmental Sustainability of Agriculture” presents the complete list of candidate indicators that were considered in the scoping analysis as well as the results of an assessment that determined the suitability of these candidate indicators...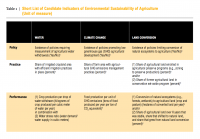
-
Fast-Start Finance Contributions
This workbook contains data from a detailed review of the 2010-2012 fast-start finance (FSF) contributions of five countries reporting the largest FSF contributions (Germany, Japan, Norway, the UK, and the USA) and from a supplemental review of the remaining FSF contributions from 31 additional...
-
Coral reefs in Kenya
This data was used in Map 6.4 and Map 6.5 in Nature's Benefits in Kenya: An Atlas of Ecosystems and Human Well-Being. The full report is available at http://www.geus.dk/program-areas/nature-environment/international/reports/kensea/kensea_rapport.pdf.
-
Percent woodlots in sampled cropland in Kenya
This data was used in Map 7.3 in Nature's Benefits in Kenya: An Atlas of Ecosystems and Human Well-Being. These data combine detailed crop information from 5,747 aerial photos for a growing season in 1997, each providing a sample point of detailed crop information. These samples were averaged...
-
Percentage Food Crops in Central and Western Kenya
World Agroforestry Center (ICRAF) and Department of Resource Surveys and Remote Sensing (DRSRS), Ministry of Environment and Natural Resources. 2001. GIS Database of Land Use and Land Cover for Kenya's Medium to High Potential Districts. DRSRS interpretation of 5,747 aerial photographs from...