-
Aqueduct Global Maps 2.0
Companies can use this information to prioritize actions, investors to leverage financial interest to improve water management, and governments to engage with the private sector to seek solutions for more equitable and sustainable water governance. Aqueduct Global Maps 2.0 includes indicators of...
-
NWIS 1997 Data (Uganda)
Some data were used in maps 4, 5, 6, 7, 8, 9, 10 of ""Mapping a Better Future: How Spatial Analysis Can Benefit Wetlands and Reduce Poverty in Uganda."" from Wetlands Management Department, Ministry of Water and Environment, Uganda; Uganda Bureau of Statistics; International Livestock Research...
-
Uganda Rural Poverty Data 2005
The poverty indicators produced by the Uganda Bureau of Statistics (UBOS) are based on household consumption expenditures, including both food and a range of nonfood items such as education, transport, health, and rent. Households are defined as poor when their total expenditures fall below...
-
Índice de Desigualdad Urbana (Index of Urban Inequality)
The main objective of the UII methodology is to estimate the level of accessibility/proximity to urban equipment for different socioeconomic strata in cities. This allows to compare and identify inequality in the territorial distribution of development opportunities such as formal employment,...
FORMATS: -
Poverty data for Kenya, 1999
This data was used in Chapters 2 and 8 in Nature's Benefits in Kenya: An Atlas of Ecosystems and Human Well-Being in Kenya. Data are downloadable at www.planning.go.ke.
-
Savannah and grassland in Kenya
This data was used in Map 1.3 in Nature's Benefits in Kenya: An Atlas of Ecosystems and Human Well-Being. Original data are downloadable at www.africover.org.
-
Reefs at Risk Revisited (Social Vulnerability Data)
This shapefile features the Exclusive Economic Zones (EEZs) for 108 coral reef countries and territories classified according to an index of their reef dependence, adaptive capacity, and social vulnerability. Results are presented as quartiles, with 27 countries/territories classified in each of...
-
Locations of water supplies serving Nairobi, Kenya.
Locations of dam were approximately located by WRI based on SoK 1971, MoWD and JICA 1992a, 1992b, 1992c, Nyaoro 1999, and Wambua 2003. This data was used in Map 3.9 in Nature's Benefits in Kenya: An Atlas of Ecosystems and Human Well-Being.
-
Featured Aqueduct Global Maps 2.1 Data
Awareness around the physical, regulatory, and reputational water risks to companies and their investors is on the rise and robust, comparable and comprehensive data is needed to help assess these water-related risks. In response to this demand, the World Resources Institute developed the...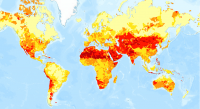
-
Basins and sub-basins in Kenya
Calculations done by the World Resources Institute. This data was used in selected maps in Nature's Benefits in Kenya: An Atlas of Ecosystems and Human Well-Being.
-
Floodplains and valley bottoms in Kenya
This data was used in Map 3.14 and Map 3.15 in Nature's Benefits in Kenya: An Atlas of Ecosystems and Human Well-Being. Original data are downloadable at www.africover.org.
-
Permanent and Non-Permanent Rivers in Kenya
This data was used in maps featured in Natures Benefits in Kenya: An Atlas of Ecosystems and Human Well-Being. Original data are available at http://mapping.usgs.gov/esic/cdrom/vmap.html.
-
Uganda Wetlands Extent and Types 1996
Data used in map 2 of "Mapping a Better Future: How Spatial Analysis Can Benefit Wetlands and Reduce Poverty in Uganda." from Wetlands Management Department, Ministry of Water and Environment, Uganda; Uganda Bureau of Statistics; International Livestock Research Institute; and World Resources...
-
Turtle nesting and breeding sites in Kenya
This data was used in Map 6.4 and Map 6.5 in Nature's Benefits in Kenya: An Atlas of Ecosystems and Human Well-Being. The full report is available at http://www.geus.dk/program-areas/nature-environment/international/reports/kensea/kensea_rapport.pdf.
-
Milk Surplus and Deficit in Central and Western Kenya in 1997
Calculations of milk production were done by assessing the number of dairy cattle in an administrative area, and extrapolating out liters of milk per area. Demand for milk was calculated by estimating the milk needs per person, and applying that number to the population density of each area....
-
Poverty data for Constituencies in eastern Kenya, 1999
This data is displayed in Map 2.6, Map 2.7, Map 2.8 and Map 2.9 in Nature's Benefits in Kenya: An Atlas of Ecosystems and Human Well-Being. It is used to show data for eastern Kenya, for which poverty data for the location- and sub-location-level were not available.
-
Existing small-scale irrigation and drainage points in Kenya
Data compiled by the International Water Management Institute (IWMI), Nairobi, Kenya. This data was used in Map 3.12 in Nature's Benefits in Kenya: An Atlas of Ecosystems and Human Well-Being.
-
Kenya Important Bird Areas (IBAs) and their Status, 2003-04
This data was used in Map 5.3 in Nature's Benefits in Kenya: An Atlas of Ecosystems and Human Well-Being. Please note that this data is frequently updated. Please refer to Birdlife International's website for most updated versions and downloads: http://www.birdlife.org/datazone/index.html
-
Percentage Food Crops in Central and Western Kenya
World Agroforestry Center (ICRAF) and Department of Resource Surveys and Remote Sensing (DRSRS), Ministry of Environment and Natural Resources. 2001. GIS Database of Land Use and Land Cover for Kenya's Medium to High Potential Districts. DRSRS interpretation of 5,747 aerial photographs from...
-
Marine Protected Areas in Coral Reef Regions of the World
This dataset is part of the base data used for Reefs at Risk Revisited. To assess the level of protection and management for coral reefs around the world. The map of MPAs and associated management effectiveness scores were used to adjust pressure from overfishing and destructive fishing in the...