-
Aqueduct Global Maps 2.0
Companies can use this information to prioritize actions, investors to leverage financial interest to improve water management, and governments to engage with the private sector to seek solutions for more equitable and sustainable water governance. Aqueduct Global Maps 2.0 includes indicators of...
-
Featured Aqueduct Global Flood Risk Maps
For the current scenario, we used hydrological data from 1960 through 1999 for generating flood inundations for 9 return periods, from 2-year flood to 1000-year flood, and 2010 GDP, population, and land use data for assessing flood impacts. For future projections, we used 5 GCMs (Global Climate...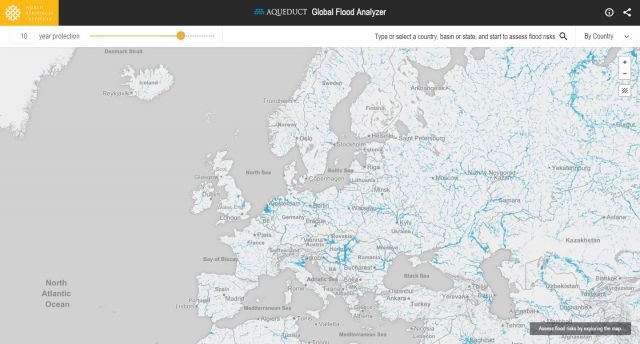
-
Featured Aqueduct Global Maps 2.1 Data
Awareness around the physical, regulatory, and reputational water risks to companies and their investors is on the rise and robust, comparable and comprehensive data is needed to help assess these water-related risks. In response to this demand, the World Resources Institute developed the...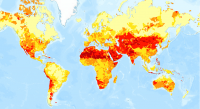
-
Global Map of Threat of Blast or Poison Fishing
This dataset was used as base data in Reefs at Risk. Map of blast and poison fishing (1 km grid) was developed for use in the Reefs at Risk Revisited project as a component of the model of overfishing and destructive fishing pressure on coral reefs. This layer designates threat of blast and...
-
Locations of water supplies serving Nairobi, Kenya.
Locations of dam were approximately located by WRI based on SoK 1971, MoWD and JICA 1992a, 1992b, 1992c, Nyaoro 1999, and Wambua 2003. This data was used in Map 3.9 in Nature's Benefits in Kenya: An Atlas of Ecosystems and Human Well-Being.
-
Uganda Rural Poverty Data 2005
The poverty indicators produced by the Uganda Bureau of Statistics (UBOS) are based on household consumption expenditures, including both food and a range of nonfood items such as education, transport, health, and rent. Households are defined as poor when their total expenditures fall below...
-
Índice de Desigualdad Urbana (Index of Urban Inequality)
The main objective of the UII methodology is to estimate the level of accessibility/proximity to urban equipment for different socioeconomic strata in cities. This allows to compare and identify inequality in the territorial distribution of development opportunities such as formal employment,...
FORMATS: -
Average water consumption of livestock and wildlife by sub-basin in Kenya, 19...
WRI/ILRI calculation based on animal data from DRSRS 2003; Grunblatt et al. 1995, 1996; and daily water requirements for selected species from MoWD and JICA 1992, Peden at al. 2003, 2004. This data was used in Map 3.13 in Nature's Benefits in Kenya: An Atlas of Ecosystems and Human Well-Being.
-
Marine Protected Areas in Coral Reef Regions of the World
This dataset is part of the base data used for Reefs at Risk Revisited. To assess the level of protection and management for coral reefs around the world. The map of MPAs and associated management effectiveness scores were used to adjust pressure from overfishing and destructive fishing in the...
-
Permanent and Non-Permanent Rivers in Kenya
This data was used in maps featured in Natures Benefits in Kenya: An Atlas of Ecosystems and Human Well-Being. Original data are available at http://mapping.usgs.gov/esic/cdrom/vmap.html.
-
Major Airfields in Kenya
This data was used in Map 6.4 and Map 6.5 featured in Natures Benefits in Kenya: An Atlas of Ecosystems and Human Well-Being.
-
Urban areas in Kenya
This data was used in Map 1.3 and in other maps throughout Nature's Benefits in Kenya: An Atlas of Ecosystems and Human Well-Being. Original data are downloadable at www.africover.org.
-
Locations of sand beaches in Kenya
This data was used in Map 6.4 and Map 6.5 in Nature's Benefits in Kenya: An Atlas of Ecosystems and Human Well-Being. Original data are downloadable at www.africover.org.
-
Forest Types in Kenya, 2000
This data was used in Map 1.3 and Map 7.1 in Nature's Benefits in Kenya: An Atlas of Ecosystems and Human Well-Being. Original data are downloadable at www.africover.org.
-
Population density of Kenya, 1999
This data was used in Map 1.6 and Map 2.5 in Nature's Benefits in Kenya: An Atlas of Ecosystems and Human Well-Being.
-
Wetlands in Kenya
This data was used in selected maps in Nature's Benefits in Kenya: An Atlas of Ecosystems and Human Well-Being. Original data are downloadable at www.africover.org.
-
Savannah and grassland in Kenya
This data was used in Map 1.3 in Nature's Benefits in Kenya: An Atlas of Ecosystems and Human Well-Being. Original data are downloadable at www.africover.org.
-
Floodplains and valley bottoms in Kenya
This data was used in Map 3.14 and Map 3.15 in Nature's Benefits in Kenya: An Atlas of Ecosystems and Human Well-Being. Original data are downloadable at www.africover.org.
-
Coral reefs in Kenya
This data was used in Map 6.4 and Map 6.5 in Nature's Benefits in Kenya: An Atlas of Ecosystems and Human Well-Being. The full report is available at http://www.geus.dk/program-areas/nature-environment/international/reports/kensea/kensea_rapport.pdf.
-
Bare areas (areas naturally devoid of vegetation) in Kenya
This data was used in Map 1.3 in Nature's Benefits in Kenya: An Atlas of Ecosystems and Human Well-Being. Original data are downloadable at www.africover.org.