-
CAIT Indonesia Climate Data Explorer (PINDAI) Data
The data set draws primarily from Local Action Plan for Greenhouse Gas Emission Reduction (RAD GRK), and Medium Term Local Development Plans (RPJMD) of each province in Indonesia. These documents are obtained from Indonesian national and regional government agencies, including the Secretariat of...
-
Reefs at Risk Revisited: Climate-Related Threats Data
Global (i.e., climate-related) threats to the world's coral reefs were analyzed. These include: past thermal stress (i.e., warming seas and bleaching over the last decade), future thermal stress (ie., projections of future warming in 2030 and 2050); and ocean acidification (i.e., reduced ocean...
-
Featured Global Power Plant Database
The Global Power Plant Database is a comprehensive, open source database of power plants around the world. It centralizes power plant data to make it easier to navigate, compare and draw insights for one’s own analysis. The database covers approximately 35,000 power plants from 167 countries and...
-
Fast-Start Finance Contributions
This workbook contains data from a detailed review of the 2010-2012 fast-start finance (FSF) contributions of five countries reporting the largest FSF contributions (Germany, Japan, Norway, the UK, and the USA) and from a supplemental review of the remaining FSF contributions from 31 additional...
-
Global Map of Threat of Blast or Poison Fishing
This dataset was used as base data in Reefs at Risk. Map of blast and poison fishing (1 km grid) was developed for use in the Reefs at Risk Revisited project as a component of the model of overfishing and destructive fishing pressure on coral reefs. This layer designates threat of blast and...
-
Featured Aqueduct Global Flood Risk Maps
For the current scenario, we used hydrological data from 1960 through 1999 for generating flood inundations for 9 return periods, from 2-year flood to 1000-year flood, and 2010 GDP, population, and land use data for assessing flood impacts. For future projections, we used 5 GCMs (Global Climate...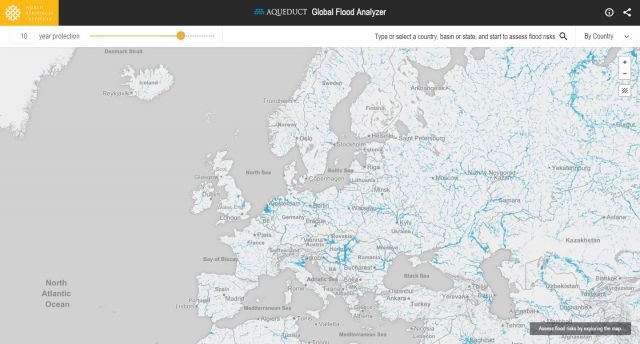
-
Land Use in Selected Indian Cities
The dataset comprises eleven series of land use/land cover (LULC) maps, each corresponding to one city in India—Ahmedabad, Belgaum, Hindupur, Hyderabad, Jalna, Kanpur, Parbhani, Pune, Singrauli, Sitapur, or Vijayawada—and containing one map per year for 2015–2018. Every map contains several...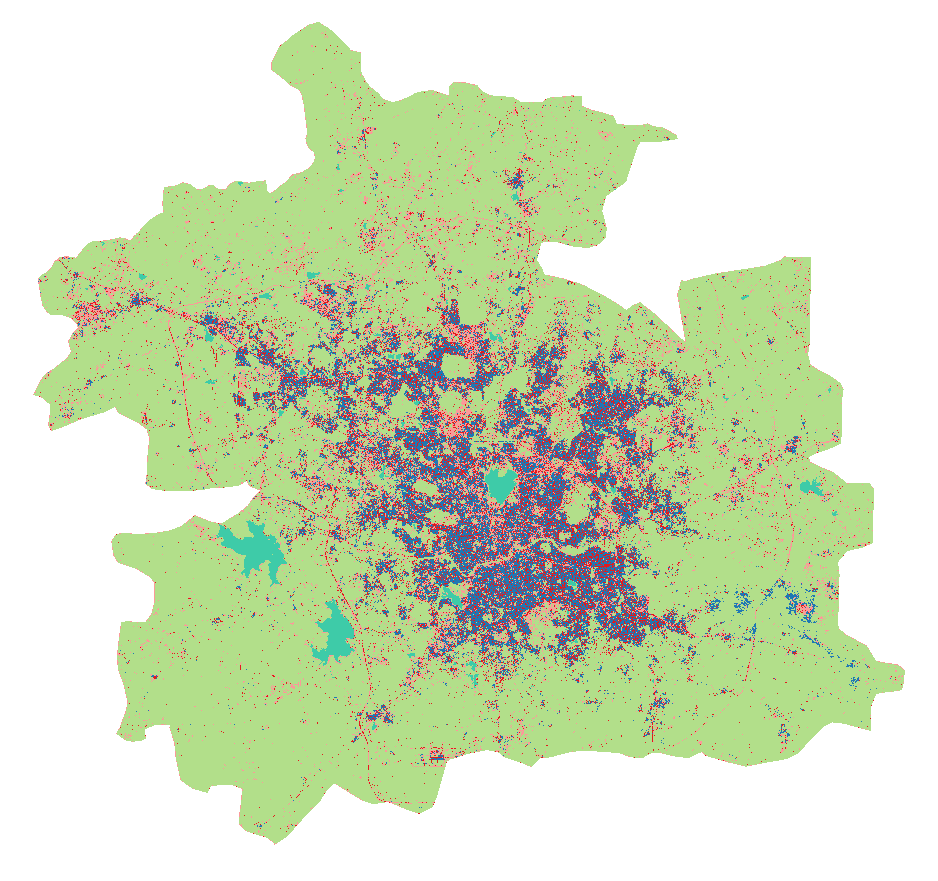
-
Reefs at Risk Revisited (Social Vulnerability Data)
This shapefile features the Exclusive Economic Zones (EEZs) for 108 coral reef countries and territories classified according to an index of their reef dependence, adaptive capacity, and social vulnerability. Results are presented as quartiles, with 27 countries/territories classified in each of...
-
Reefs at Risk Revisited (Local Threats Data)
Threats from coastal development, marine-based pollution and damage, overfishing and destructive fishing, and watershed-based pollution were analyzed separately. These threats were integrated into the Integrated Local Threat index. Past thermal stress was integrated with local threats into the...