-
Eutrophication & Hypoxia Map Data Set
The Interactive Map of Eutrophication & Hypoxia represents 762 coastal areas impacted by eutrophication and/or hypoxia. There are 479 sites identified as experiencing hypoxia, 55 sites that once experienced hypoxia but are now improving, and 228 sites that experience other symptoms of...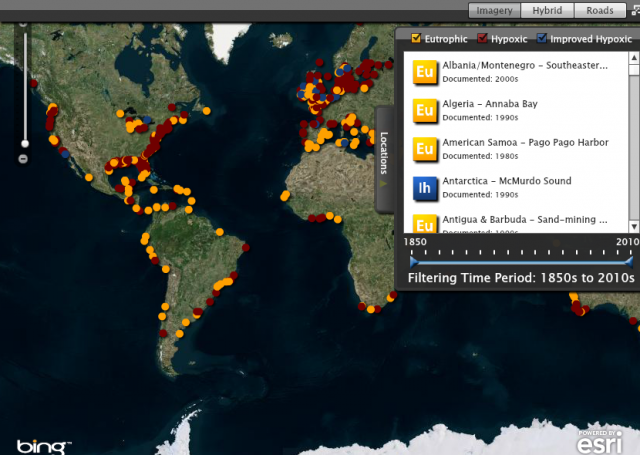
-
CAIT Indonesia Climate Data Explorer (PINDAI) Data
The data set draws primarily from Local Action Plan for Greenhouse Gas Emission Reduction (RAD GRK), and Medium Term Local Development Plans (RPJMD) of each province in Indonesia. These documents are obtained from Indonesian national and regional government agencies, including the Secretariat of...
-
Digital Globe GEO1 Satellite Imagery
Effective emergency planning and response requires quick and easy access to accurate, up-to-date information. DigitalGlobe’s FirstLook is an online subscription service for emergency management that provides fast web-based access to pre-and post-event imagery of world disasters delivered to...
-
Digital Globe QB01 Satellite Imagery
Effective emergency planning and response requires quick and easy access to accurate, up-to-date information. DigitalGlobe’s FirstLook is an online subscription service for emergency management that provides fast web-based access to pre-and post-event imagery of world disasters delivered to...
-
Digital Globe WV01 Satellite Imagery
Effective emergency planning and response requires quick and easy access to accurate, up-to-date information. DigitalGlobe’s FirstLook is an online subscription service for emergency management that provides fast web-based access to pre-and post-event imagery of world disasters delivered to...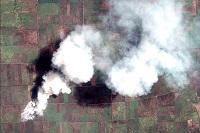
-
Floodplains and valley bottoms in Kenya
This data was used in Map 3.14 and Map 3.15 in Nature's Benefits in Kenya: An Atlas of Ecosystems and Human Well-Being. Original data are downloadable at www.africover.org.
-
Locations of sable antelope sites, Kenya
This data was used in Map 6.4 and Map 6.5 in Nature's Benefits in Kenya: An Atlas of Ecosystems and Human Well-Being. Original data and report are downloadable at http://www.unep.org/eafatlas/dbke.htm.
-
Size of Agricultural Crops in Kenya
Used in Map 5.7 of Nature's Benefits in Kenya: An Atlas of Ecosystems and Human Well-Being. Original data are downloadable at www.africover.org.
-
Percent of Land under Cultivation in Kenya
Used in Map 5.4 of Nature's Benefits in Kenya: An Atlas of Ecosystems and Human Well-Being.Original data are downloadable at www.africover.org.
-
CAIT - Country Clean Technology Data
This collection emerges from a collaboration of five leading research institutions: World Resources Institute (WRI), Institute for Global Environmental Strategies (IGES), Öko Institut, Renmin University, and The Energy and Resources Institute (TERI), based in the target countries. Researchers at...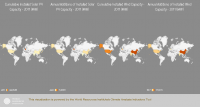
-
Locations of small micro-hydropower sites in Kenya
Locations of micro-hydro sites approximately located by WRI based on SoK 1971, and information from KenGen 2006, and Balla 2006. This data was used in Map 3.11 in Nature's Benefits in Kenya: An Atlas of Ecosystems and Human Well-Being.
-
Poverty data for Kenya, 1999
This data was used in Chapters 2 and 8 in Nature's Benefits in Kenya: An Atlas of Ecosystems and Human Well-Being in Kenya. Data are downloadable at www.planning.go.ke.
-
Kenya Important Bird Areas (IBAs) and their Status, 2003-04
This data was used in Map 5.3 in Nature's Benefits in Kenya: An Atlas of Ecosystems and Human Well-Being. Please note that this data is frequently updated. Please refer to Birdlife International's website for most updated versions and downloads: http://www.birdlife.org/datazone/index.html
-
Uganda Safe Water Coverage
Rural safe water coverage as defined by the Directorate of Water Development, Ministry of Water and Environment, Uganda. Data used in maps 3, 4, 5, 6 of ""Mapping a Healthier Future: How Spatial Analysis Can Guide Pro-Poor Water and Sanitation Planning in Uganda."" from Health Planning...
-
Land Use in Selected Indian Cities
The dataset comprises eleven series of land use/land cover (LULC) maps, each corresponding to one city in India—Ahmedabad, Belgaum, Hindupur, Hyderabad, Jalna, Kanpur, Parbhani, Pune, Singrauli, Sitapur, or Vijayawada—and containing one map per year for 2015–2018. Every map contains several...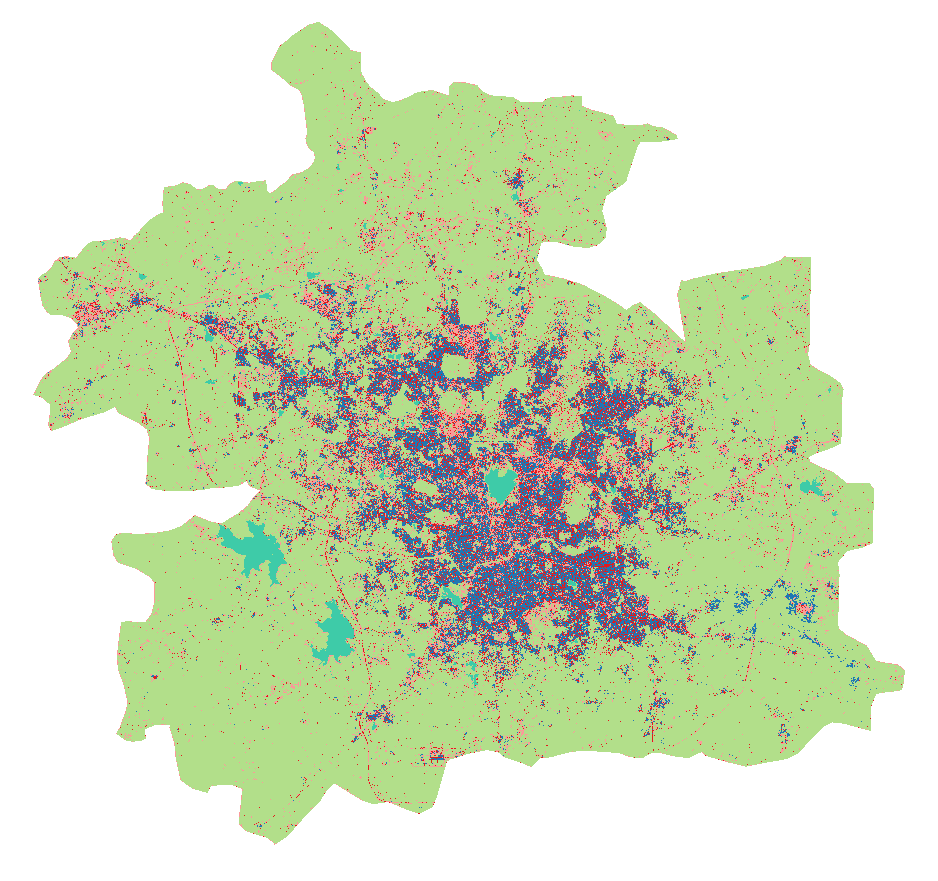
-
Featured Intact Forest Landscapes (2013)
"The Intact Forest Landscapes (IFL) data set identifies unbroken expanses of natural ecosystems within the zone of forest extent that show no signs of significant human activity and are large enough that all native biodiversity, including viable populations of wide-ranging species, could be...
-
Indicators of Sustainable Agriculture: A Scoping Analysis
The spreadsheet “Evaluation of Candidate Indicators of Environmental Sustainability of Agriculture” presents the complete list of candidate indicators that were considered in the scoping analysis as well as the results of an assessment that determined the suitability of these candidate indicators...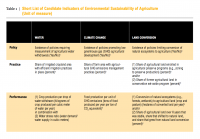
-
Fast-Start Finance Contributions
This workbook contains data from a detailed review of the 2010-2012 fast-start finance (FSF) contributions of five countries reporting the largest FSF contributions (Germany, Japan, Norway, the UK, and the USA) and from a supplemental review of the remaining FSF contributions from 31 additional...
-
WRI Ross Center for Sustainable Cities’ Water and Sanitation 15-City Study
To address the absence of comparable city-level water data, this dataset compiles data from 15 global South cities located in sub-Saharan Africa, South Asia, and Latin America and among the regions that are the focus of the World Resources Report (WRR) "Towards a More Equal City". The 15 cities...
-
Climate Watch - U.S. States Greenhouse Gas Emissions
Climate Watch Historical GHG Emissions module enables data analysis by allowing users to quickly narrow down by year, gas, state, and sector. Automatic calculations for percent changes from prior year, per capita, per GDP, and cumulative number across years are also available. Users are presented...