Dataset View Pages
-
a. Data Files
-
d. Map preview
b. About Tab
d. Contact Tab
e. Api Tab
Assuming you’ve gone through the Basic and Advanced search page and you’ve identified the Dataset you would like to view or you have a direct link to a Dataset, here is the description of what the Dataset page should look like:
On visiting a Dataset, the layout should look like the following
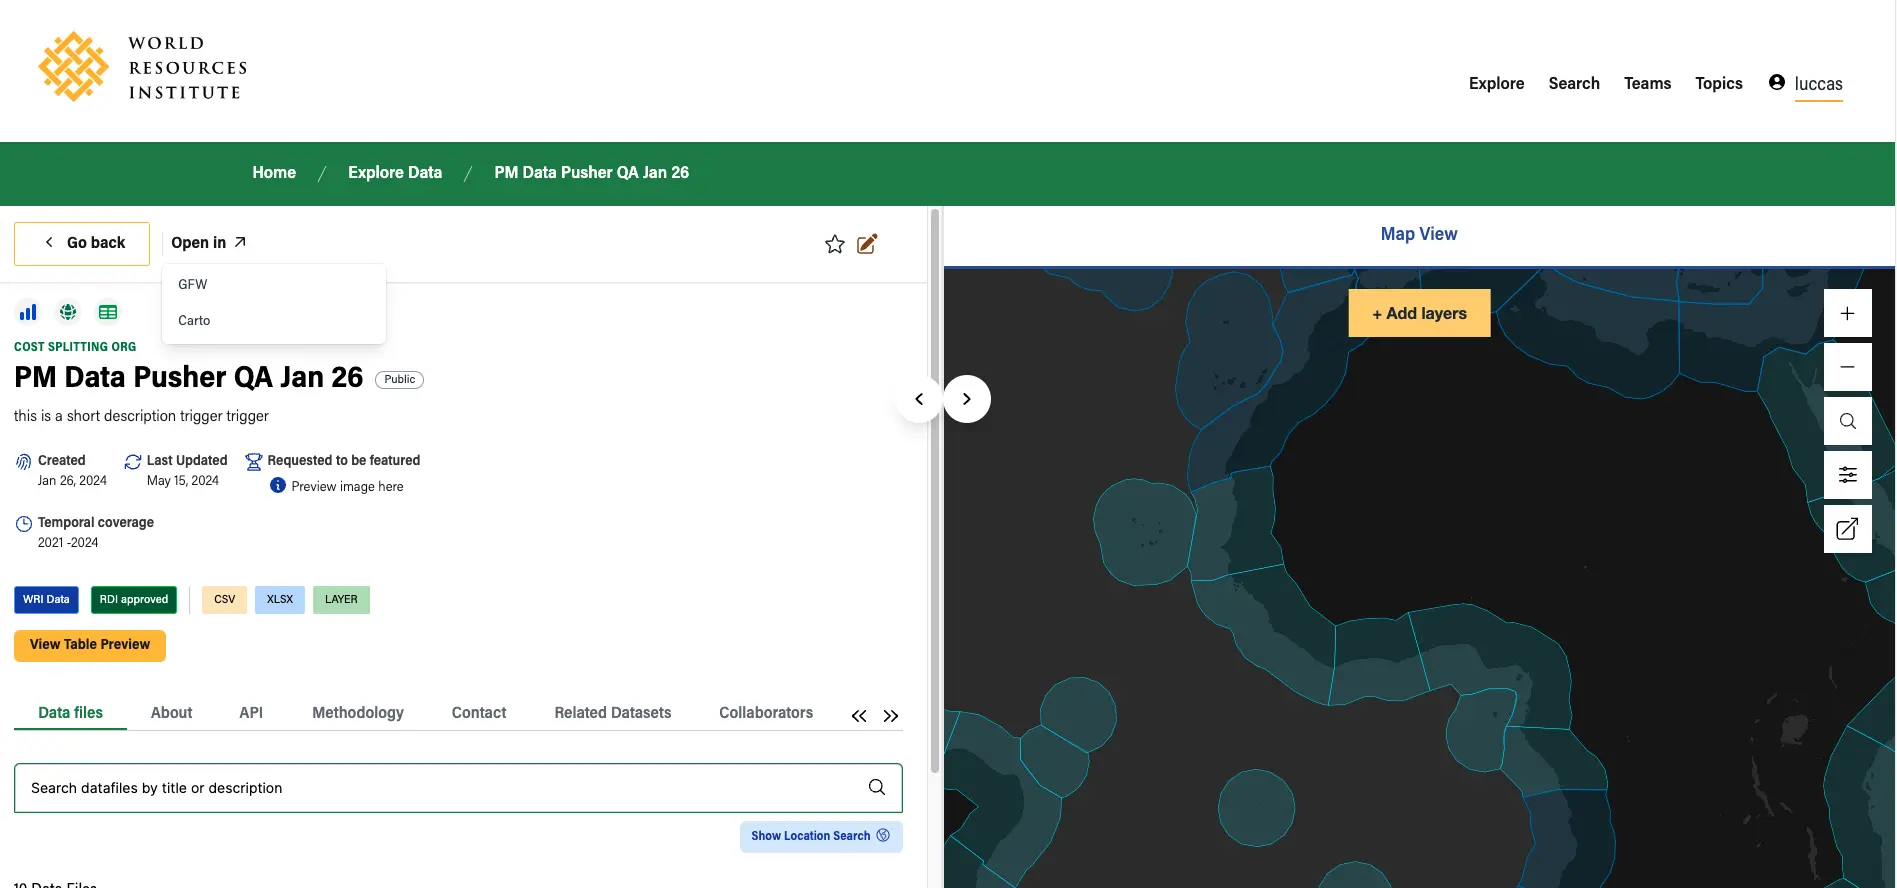
The layout is divided into sections, The left side contains the Dataset’s detailed information, ranging from metadata to Data Files and a list of all other entities, and the right-hand side contains Preview sections.
For the preview section, the image display above shows Map preview, and that's because the Dataset contains a layer Data File, and in cases where no layer Data Files is available, but tabular Data Files are present, the preview section will contain a tabular preview and if no Data Files at all, the preview section will be empty.
Dataset Metadata
Starting from the Open in GFW button, the button enables us to open the same Dataset layer in Global Forest Watch which is one of WRI’s products. And sometimes if the the Dataset have a general tabular or gis daata the provider of such data will be listed and just like GFW, clicking on it will direct us to the provider site.
The top part of the metadata contains 3 sets of icons from left to right, showing that chart view, map view, and Tabular view are present for this Dataset
The COST SPLITTING ORG signifies the title of the organization this Dataset belongs.
PM DATA PUSHER QA Jan 26 signifies the title of the Dataset. this is a short description trigger this represents the text added to the short description field when creating or editing the Dataset.
Below the short description, contains 4 metadata which are self-explanatory, show when the Dataset was created and updated, and show the temporal coverage, it also indicates that the Dataset
The WRI DATA tag shows that WRI developed this Dataset. this will be present in the view of this field (This Dataset was developed by WRI ) while creating or editing the Dataset
The RDI approved tags show when a Technical note is added. The csv , XLSX , LAYER show that this Dataset contains three types of Data Files.
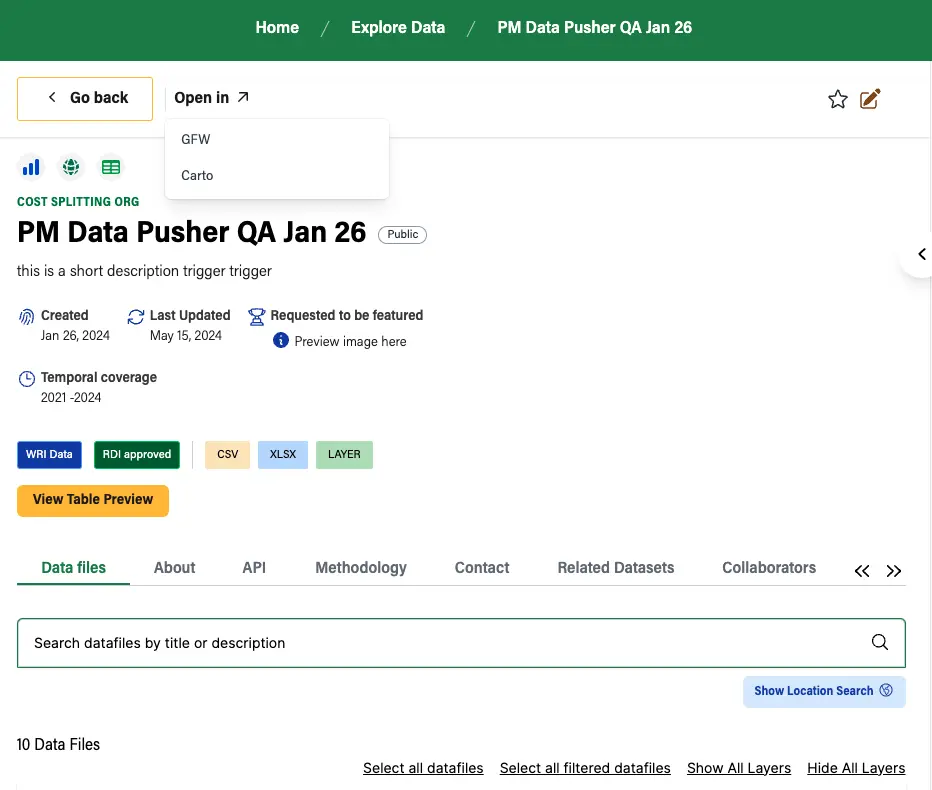
The View Table preview once clicked display the table in the preview panel
once you are done previewing the table you can click on Remove Tabular preview , We will not be bothered about the tabular preview for now, it will be discussed in some sections from now.
Dataset Tabs
After the Dataset header and metadata we have a list of tabs,

The >> is used to see the remaining collapsed tabs, and if the left section is expanded we can see the full tabs.
Data Files
This tab contains the list of Data Files belonging to the Dataset
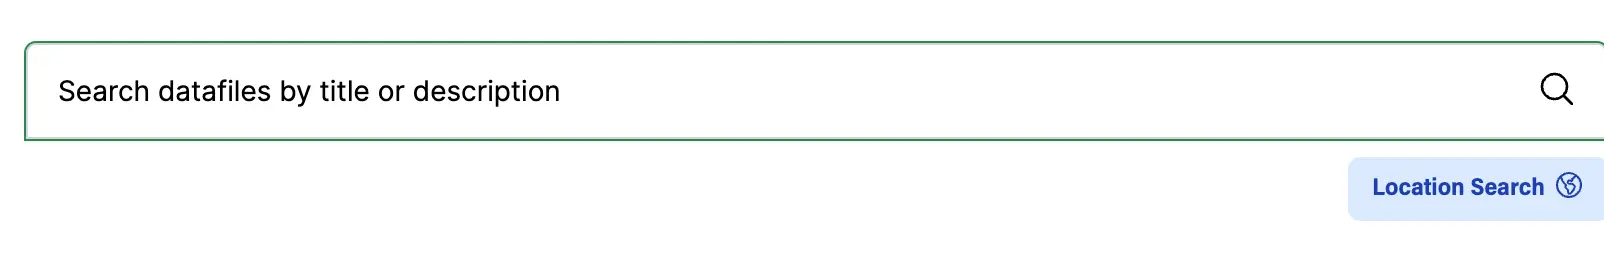
First, we have the search section, which enables us to search Data Files based on title and description. To search by location, click on the Location Search to enable the map view and map search
Location Search
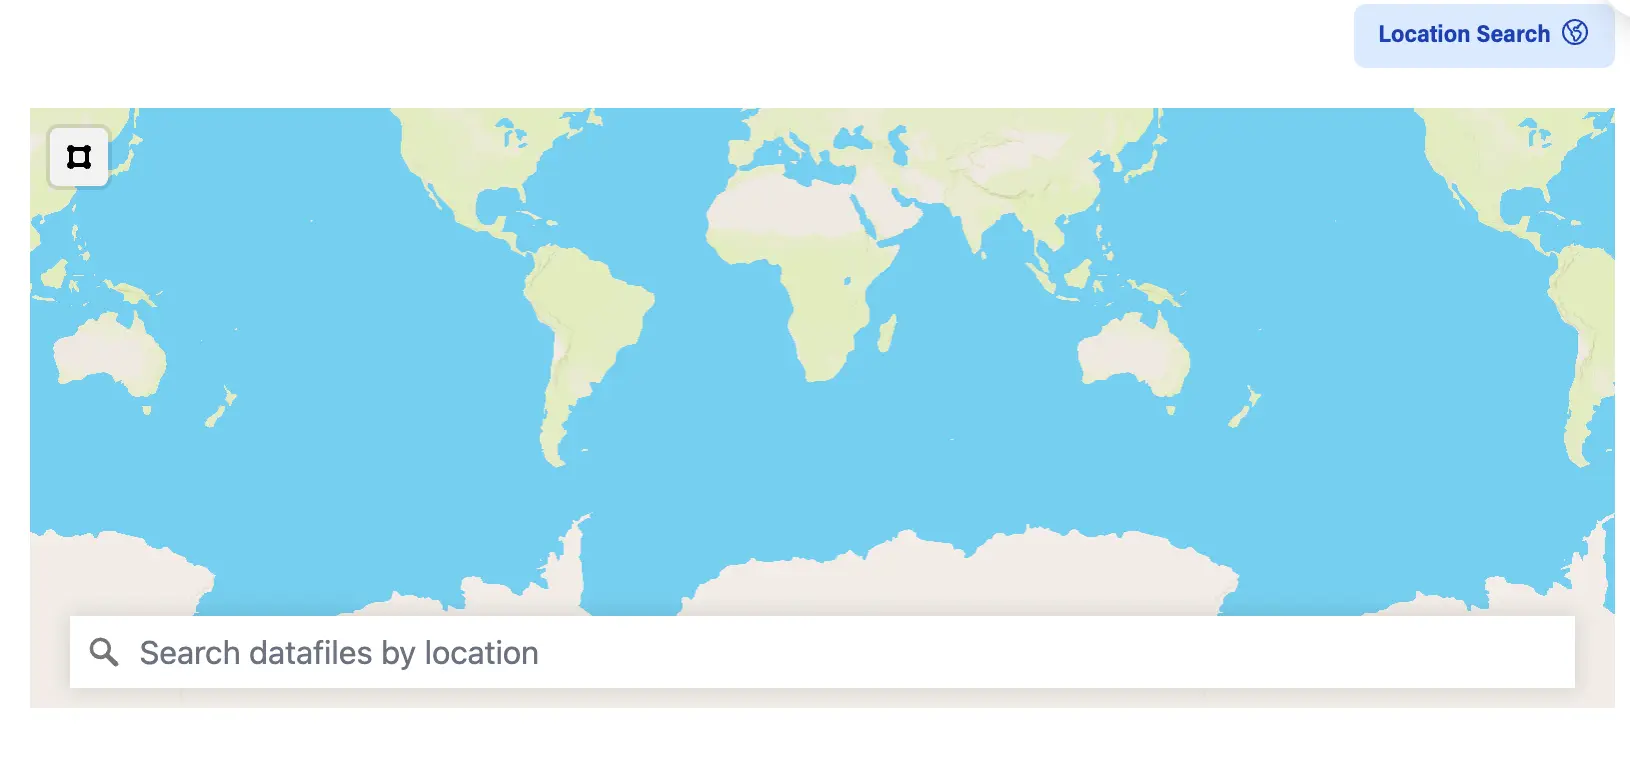
In that map, you can search using a bbox by clicking on the square at the top left section of the map, and drawing a rectangle on it
-
If that rectangle intersects or covers a geojson shape that is attached to a Data Files, that Data Files will then appear
-
If that rectangle covers the center coordinate of an address that is attached to a Data Files, that Data Files will also appear
Besides that, we also have an autocomplete field for addresses, which will match in the following way
-
If the center of that address is inside the geojson attached to a Data Files, then that Data Files will appear
-
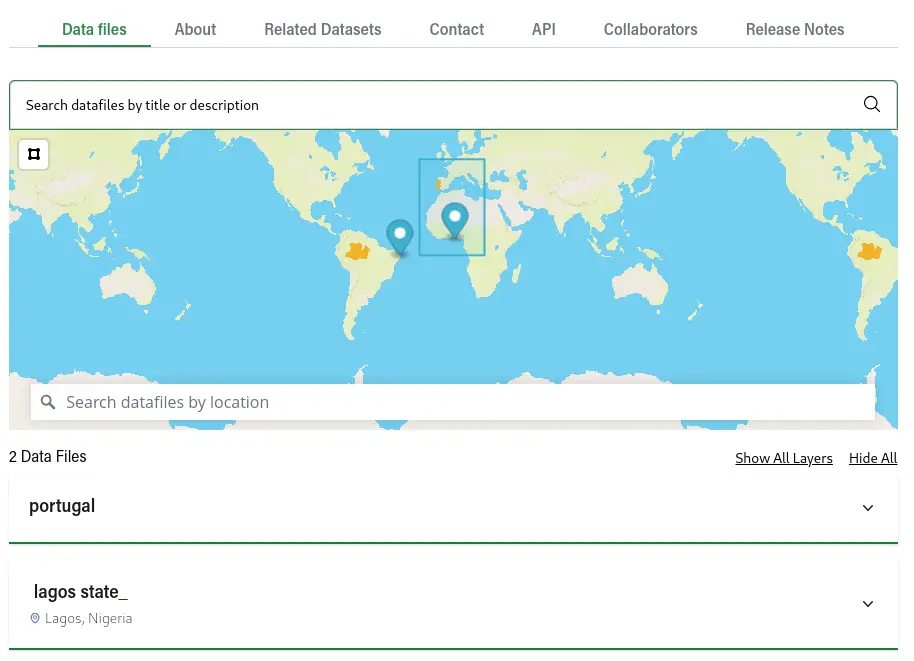
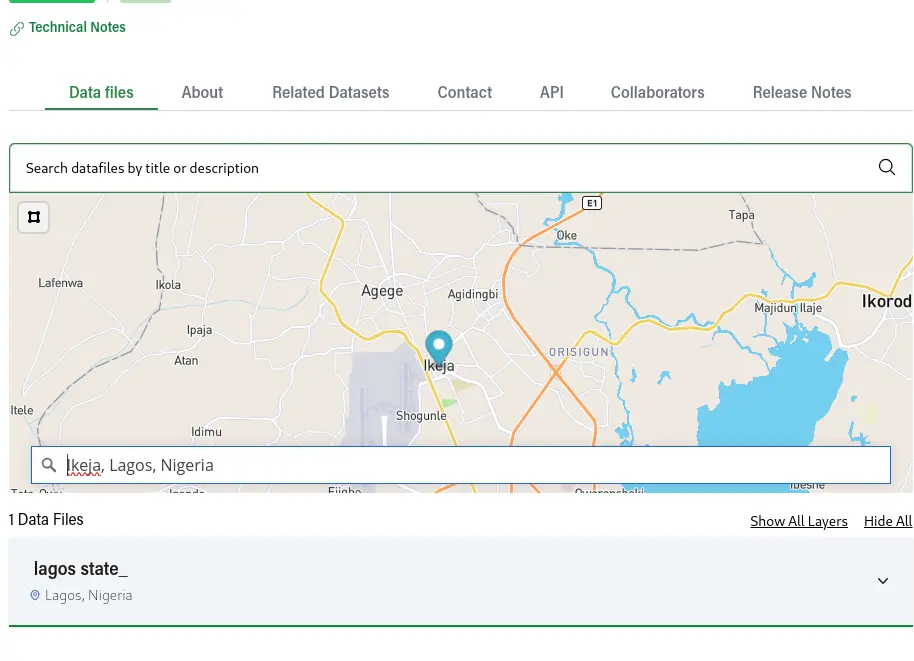
If the address typed matches or is contained by the address in a specific Data Files, then that Data Files will appear, for example, in the image below, we have a Data Files that is attached to the state of Lagos in Nigeria, if we type Ikeja, Lagos, Nigeria, which is a city inside that particular state, the result will match, given that possibly data about the state of Lagos will also contain data about that particular city
Data File list section
contains all the default or filtered Data Files
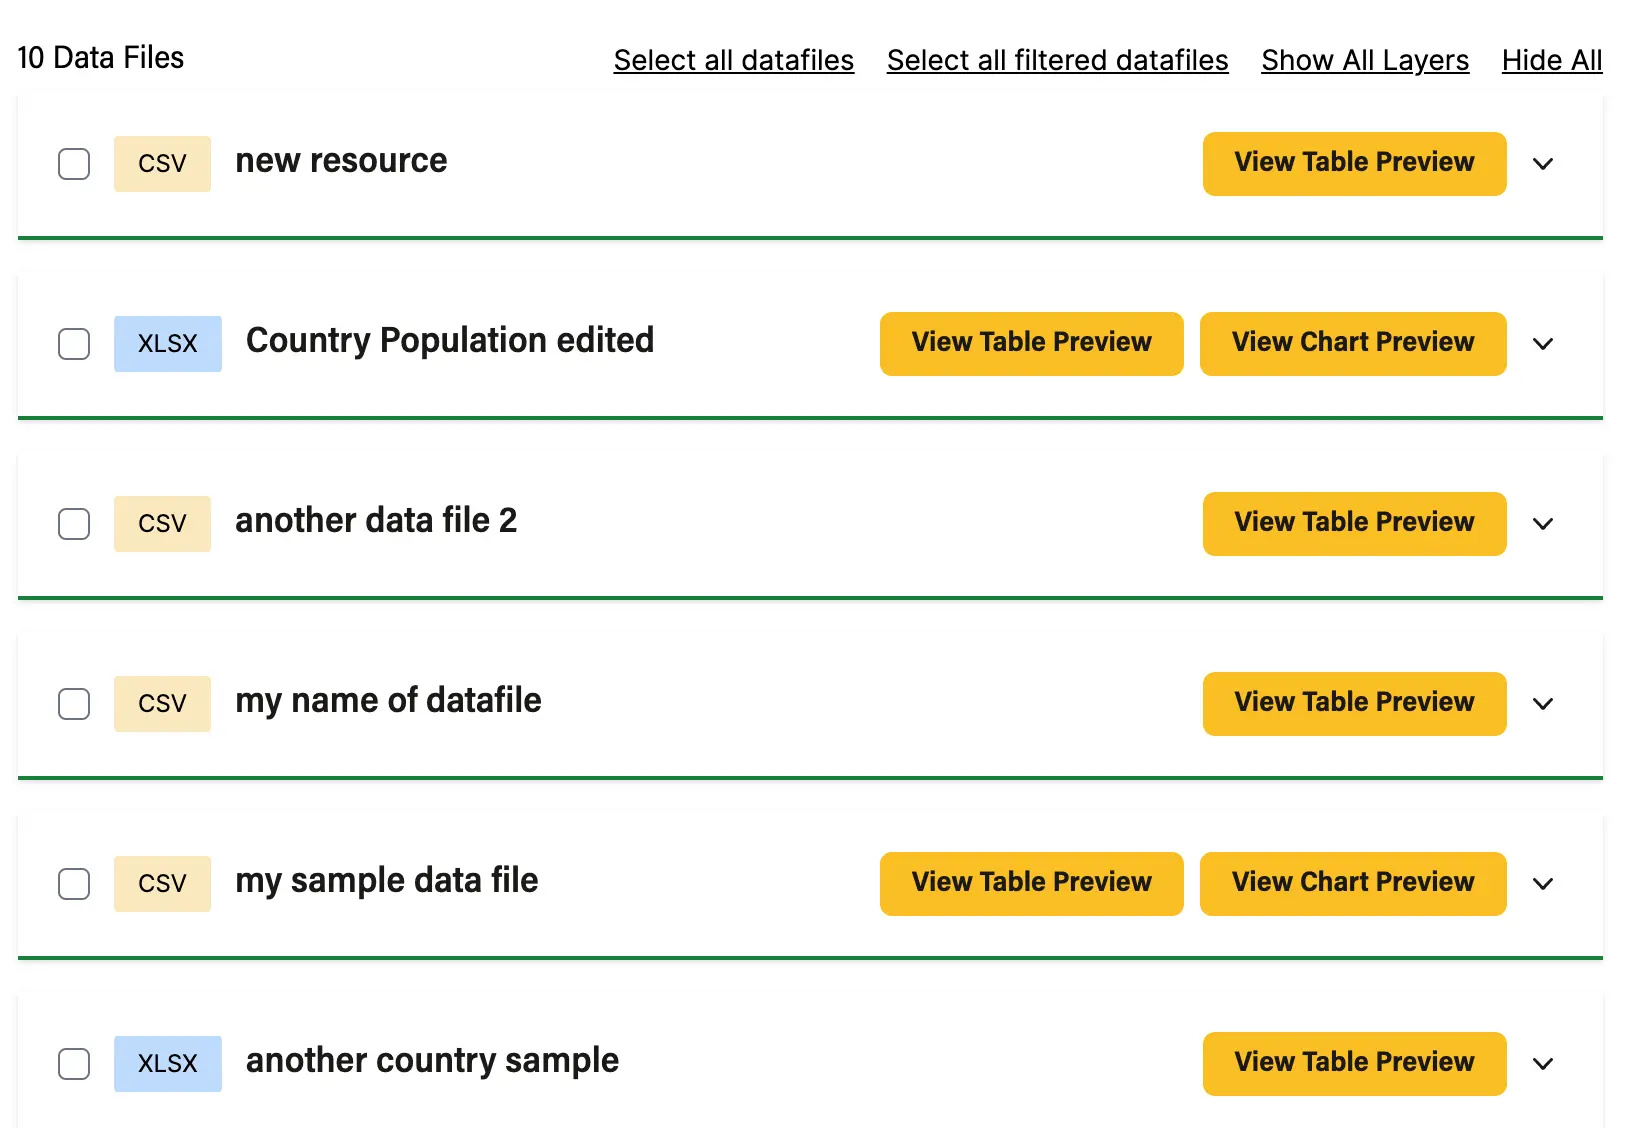
Data File download
As shown in the image above, we have different control buttons e.g Select all Data Files this selects all the tabular Data Files and then displays the Download selected Data Files to download all selected files as a zipped file
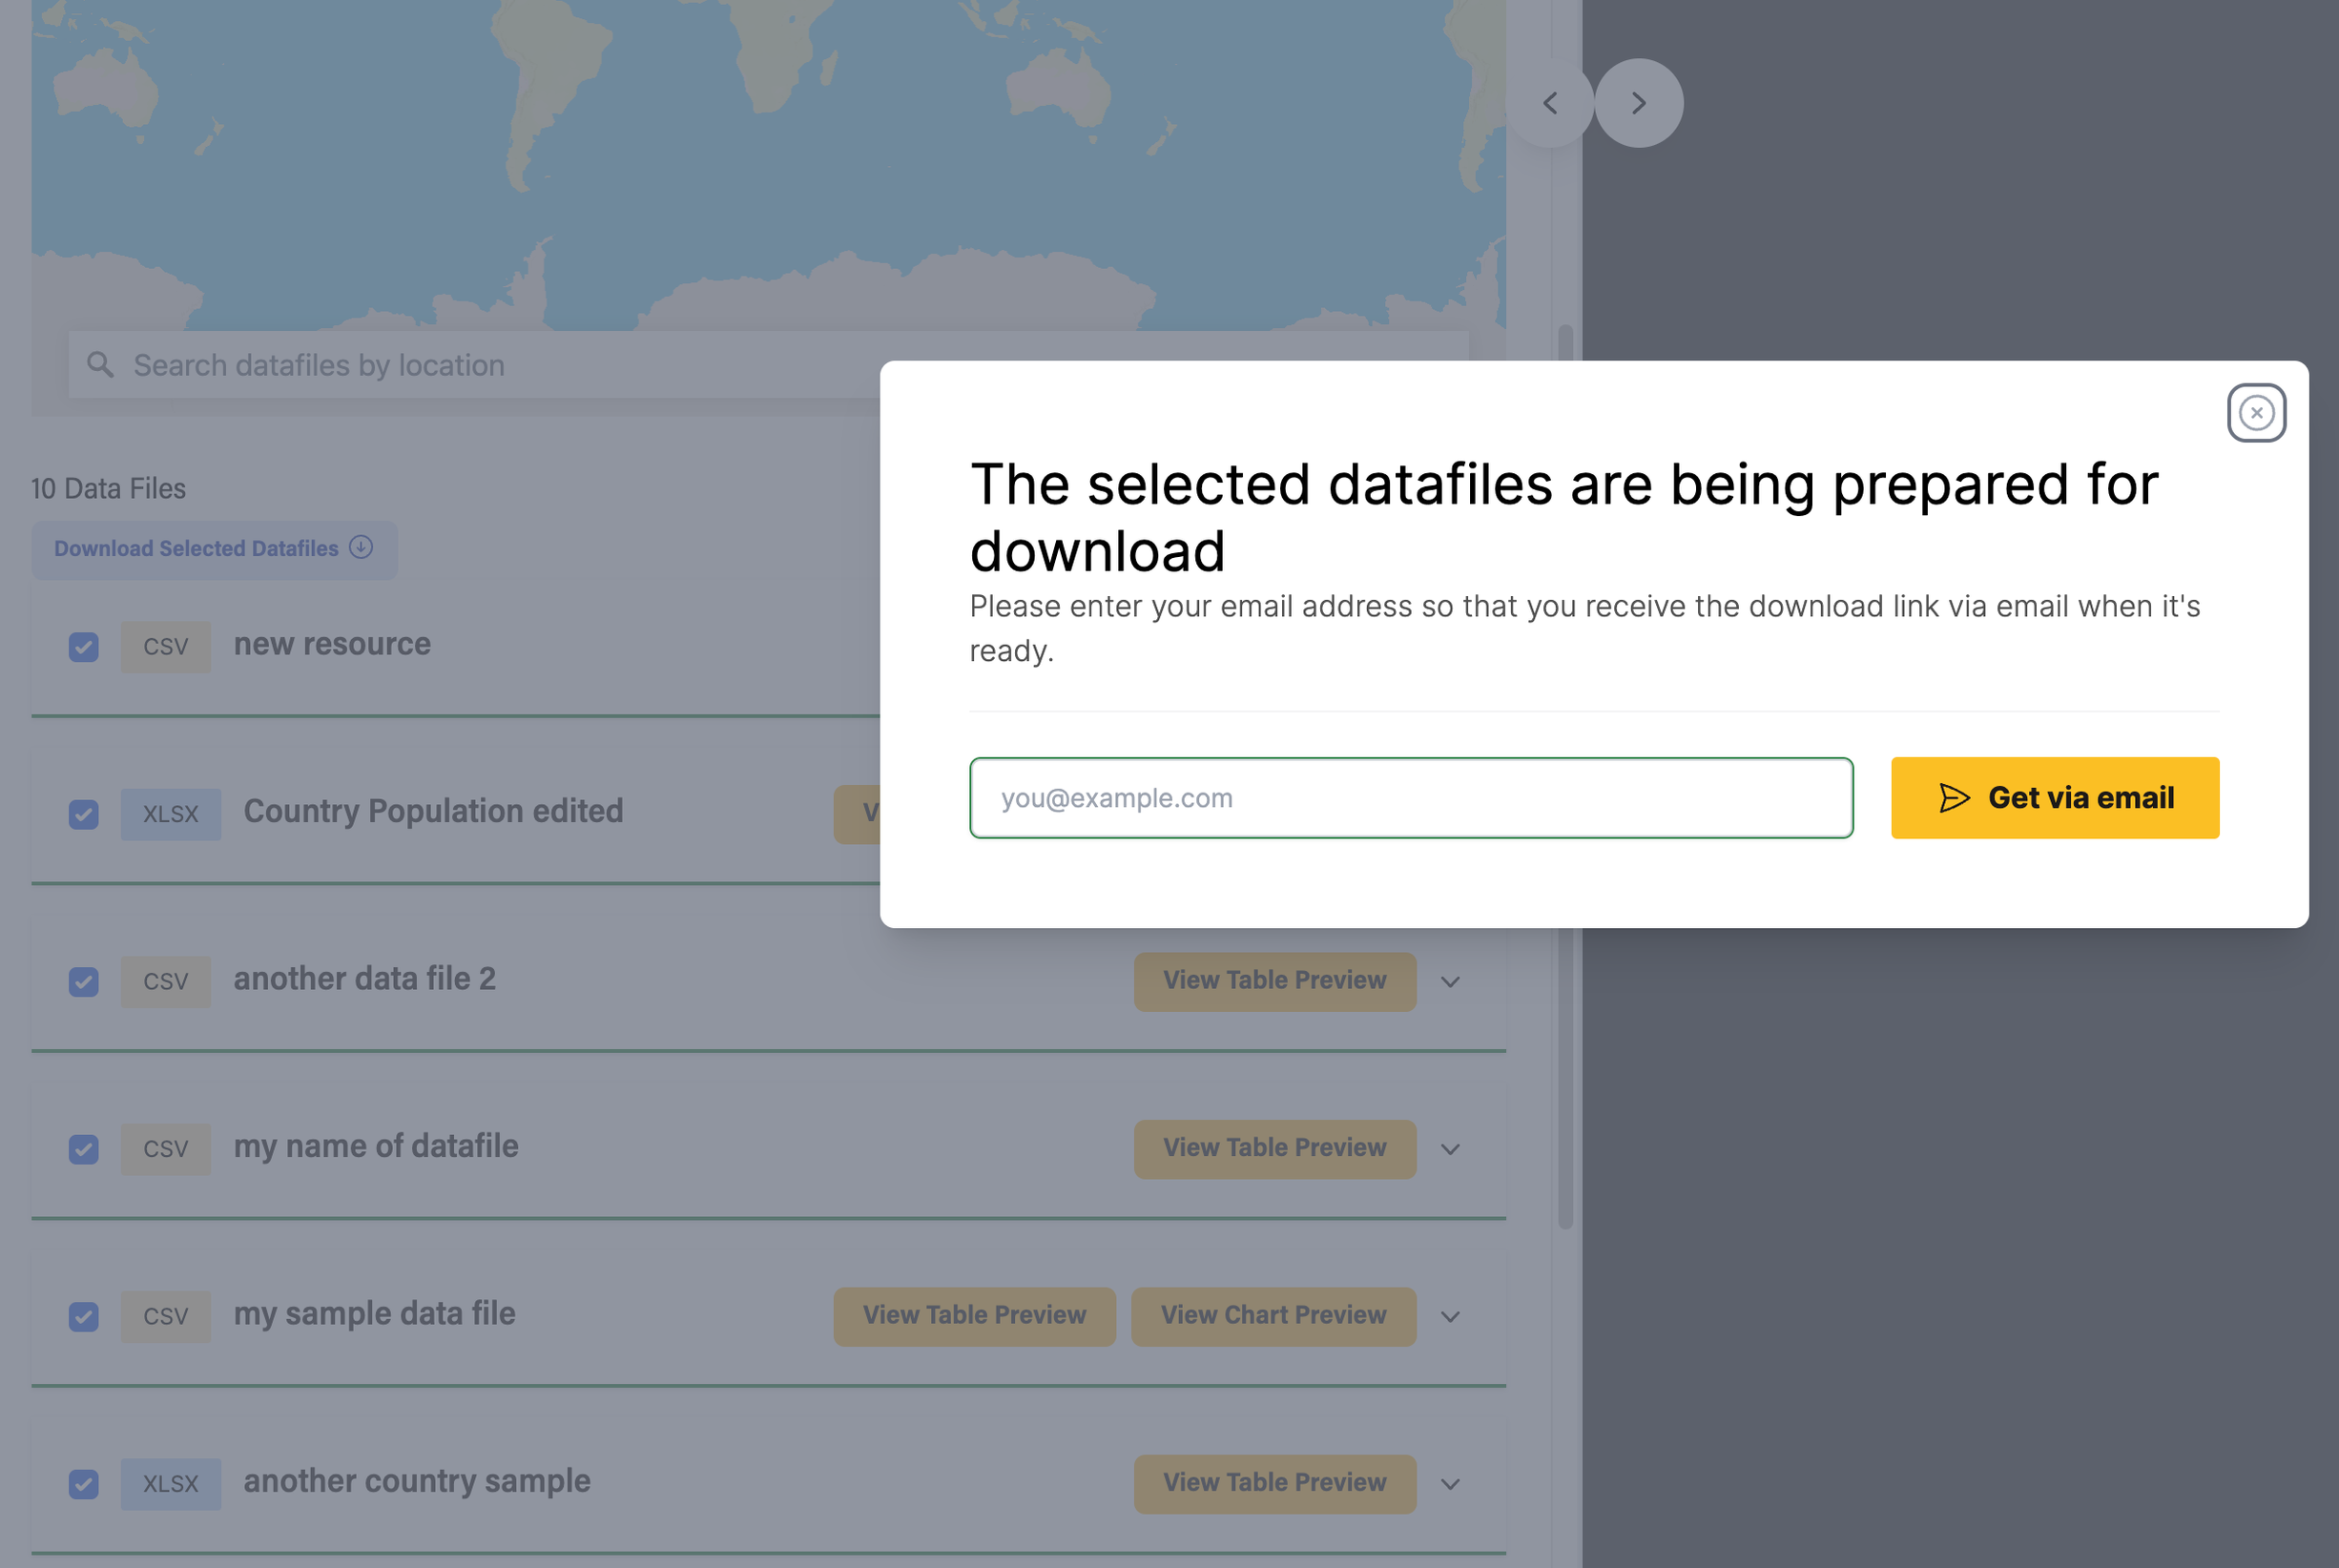
Once you filled the form, the zipped file will be sent to your email once its ready. and to download a single file, click on the dropdown icon for the Data Files you want to download and then click download
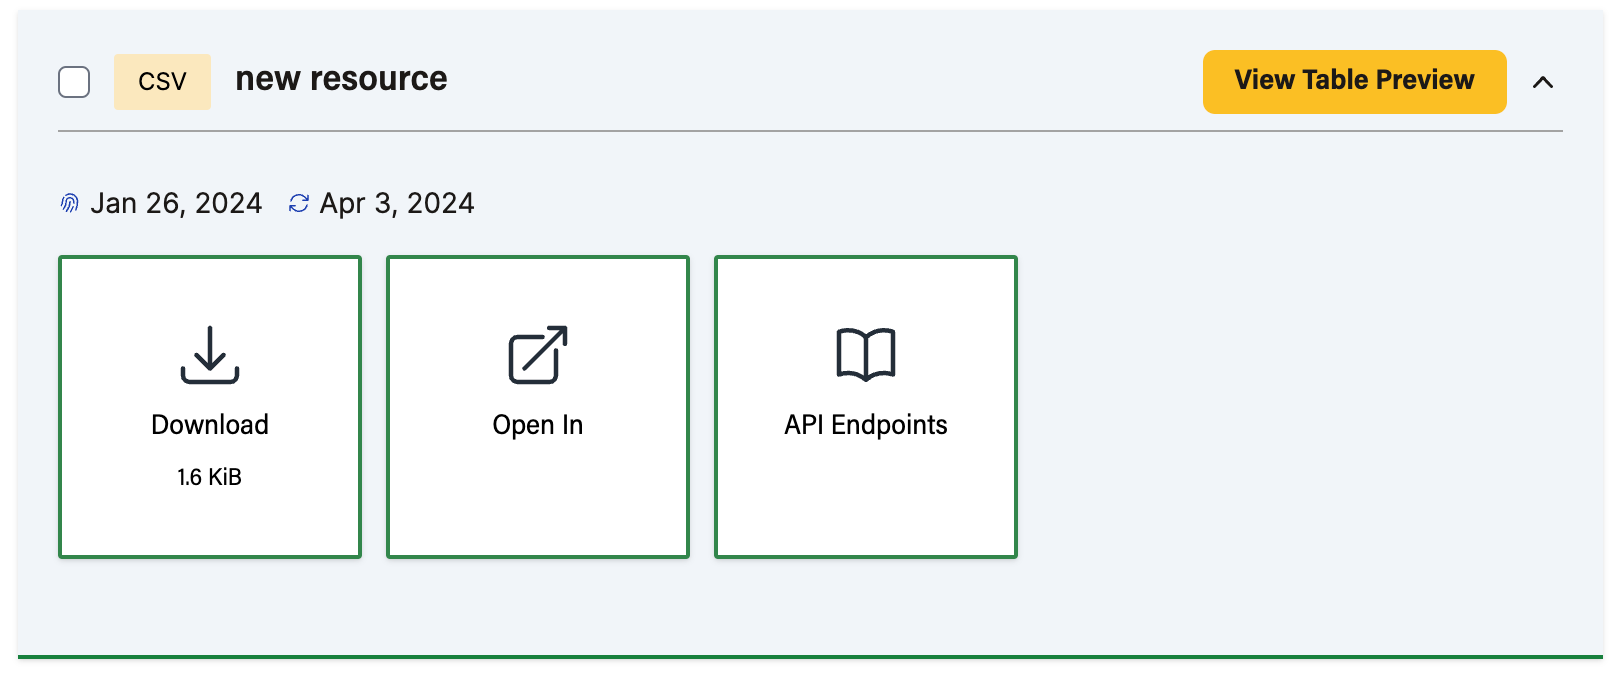
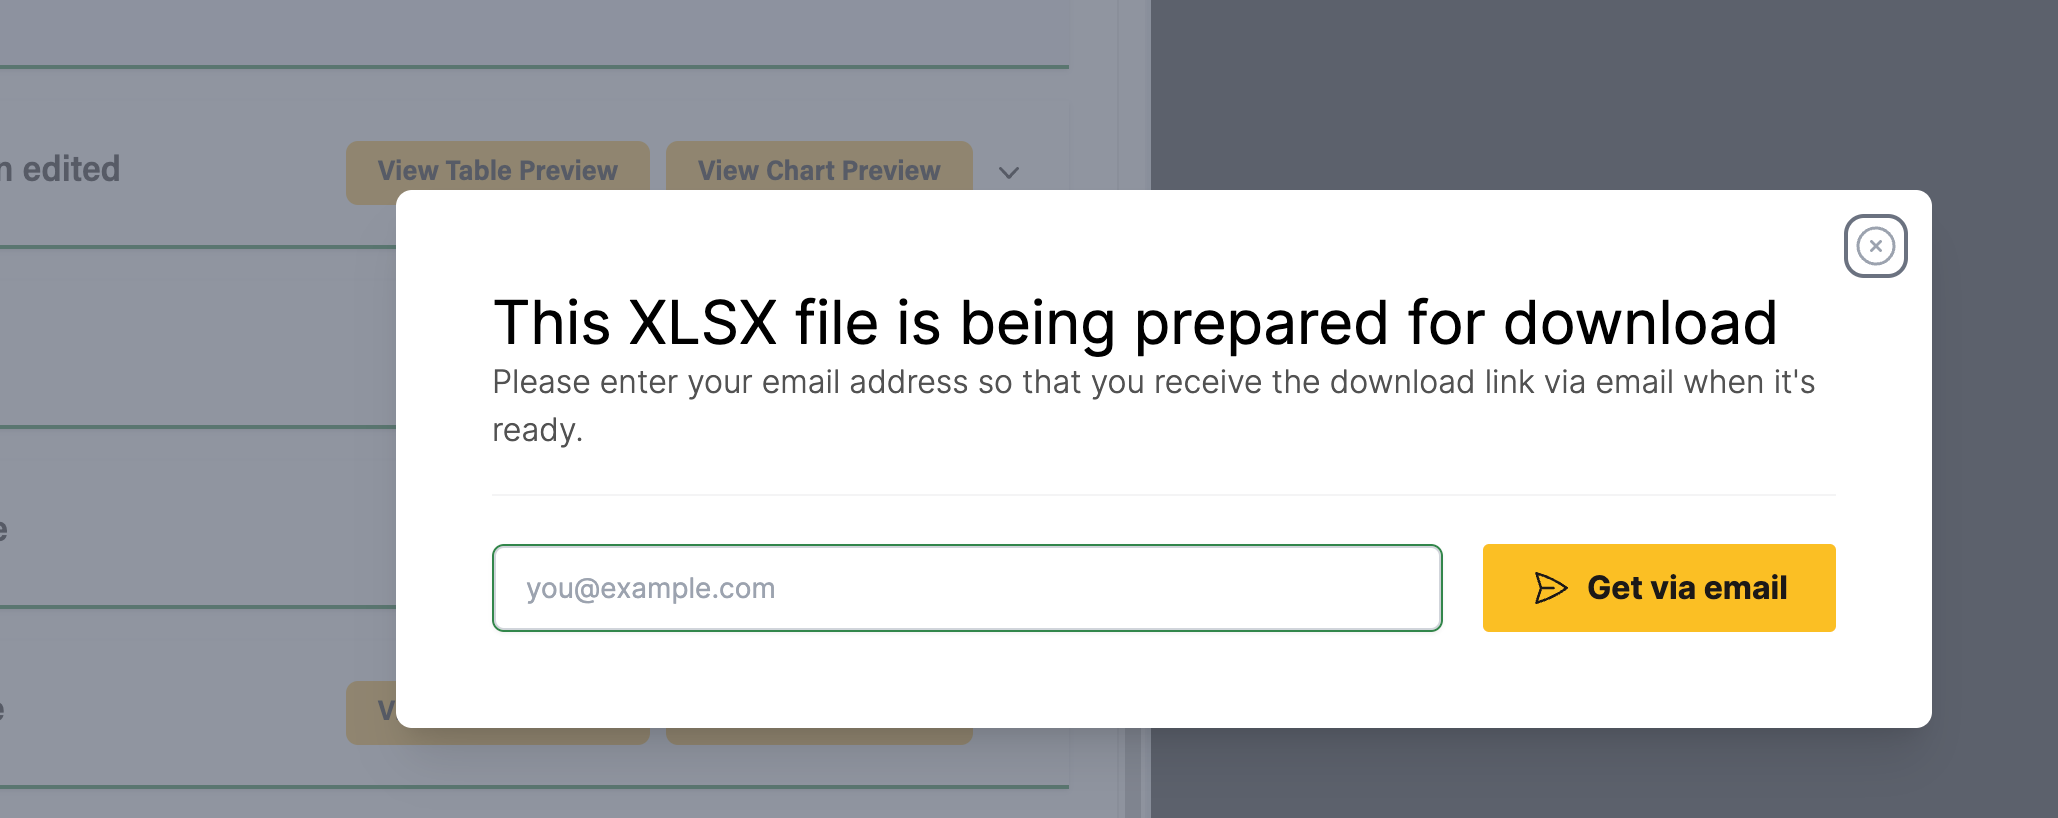
the file can be downloaded in different formats
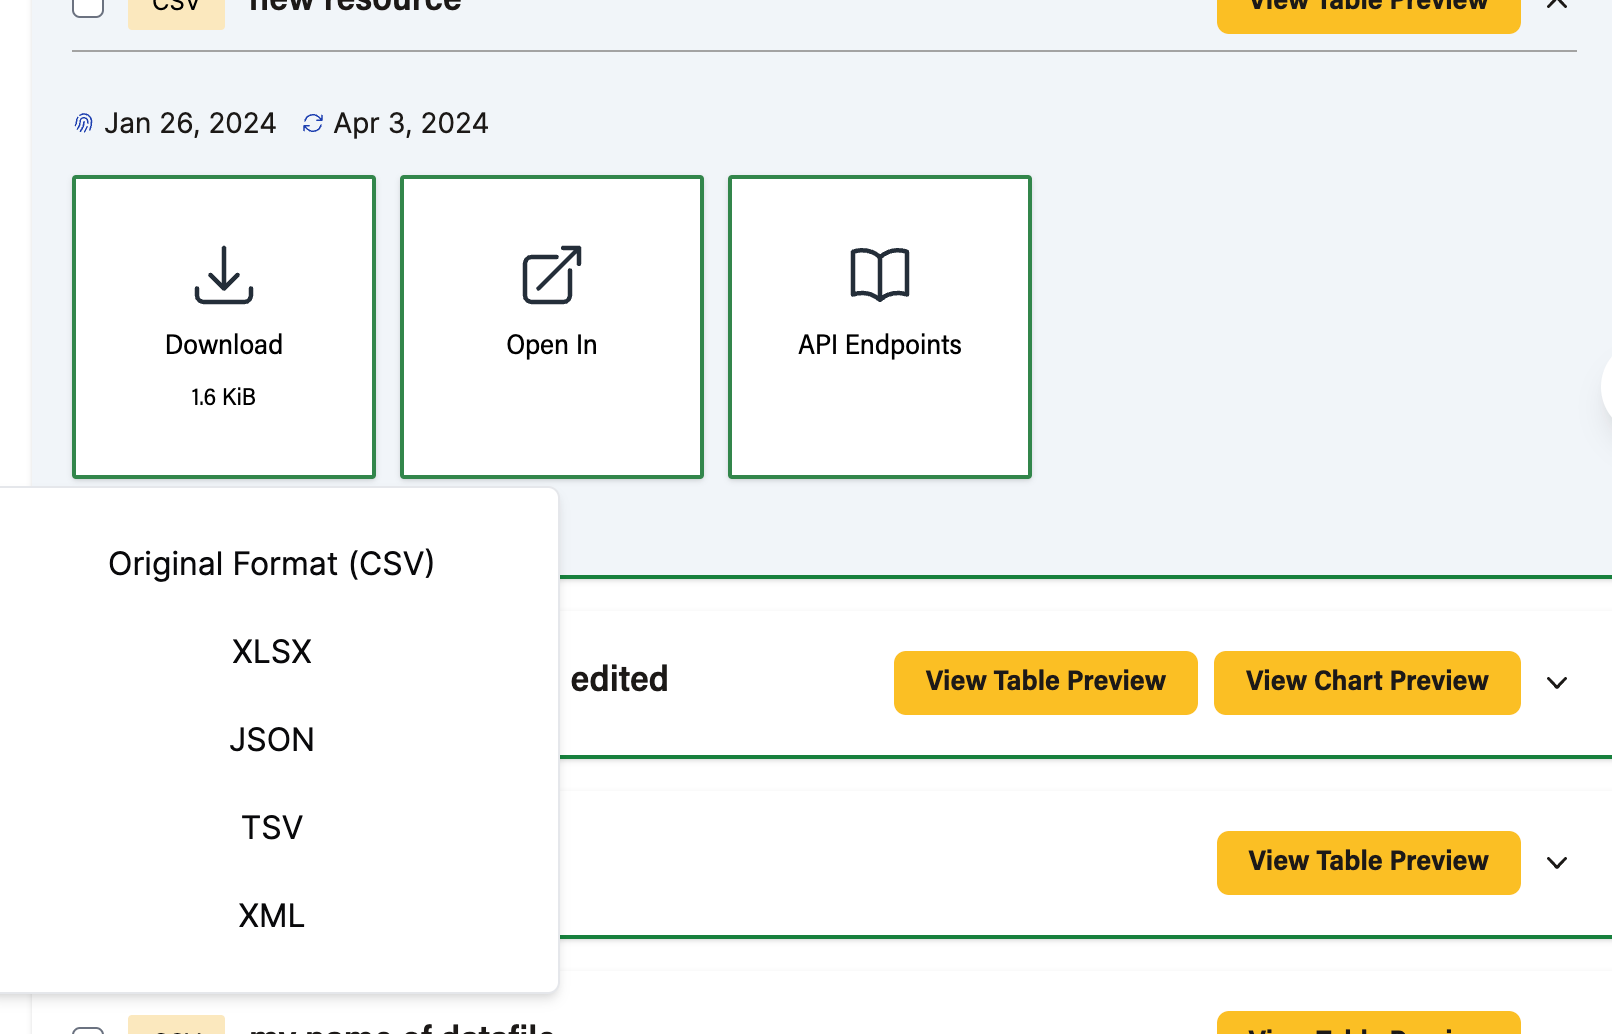
If the original format is clicked, the download is an instance if, for any other format, it has to undergo some processing, hence you will need to add your email to the popped-up modal
Also, we have the Show all layers and Hide All this to display and hide the combined map view of all layer Data Files.
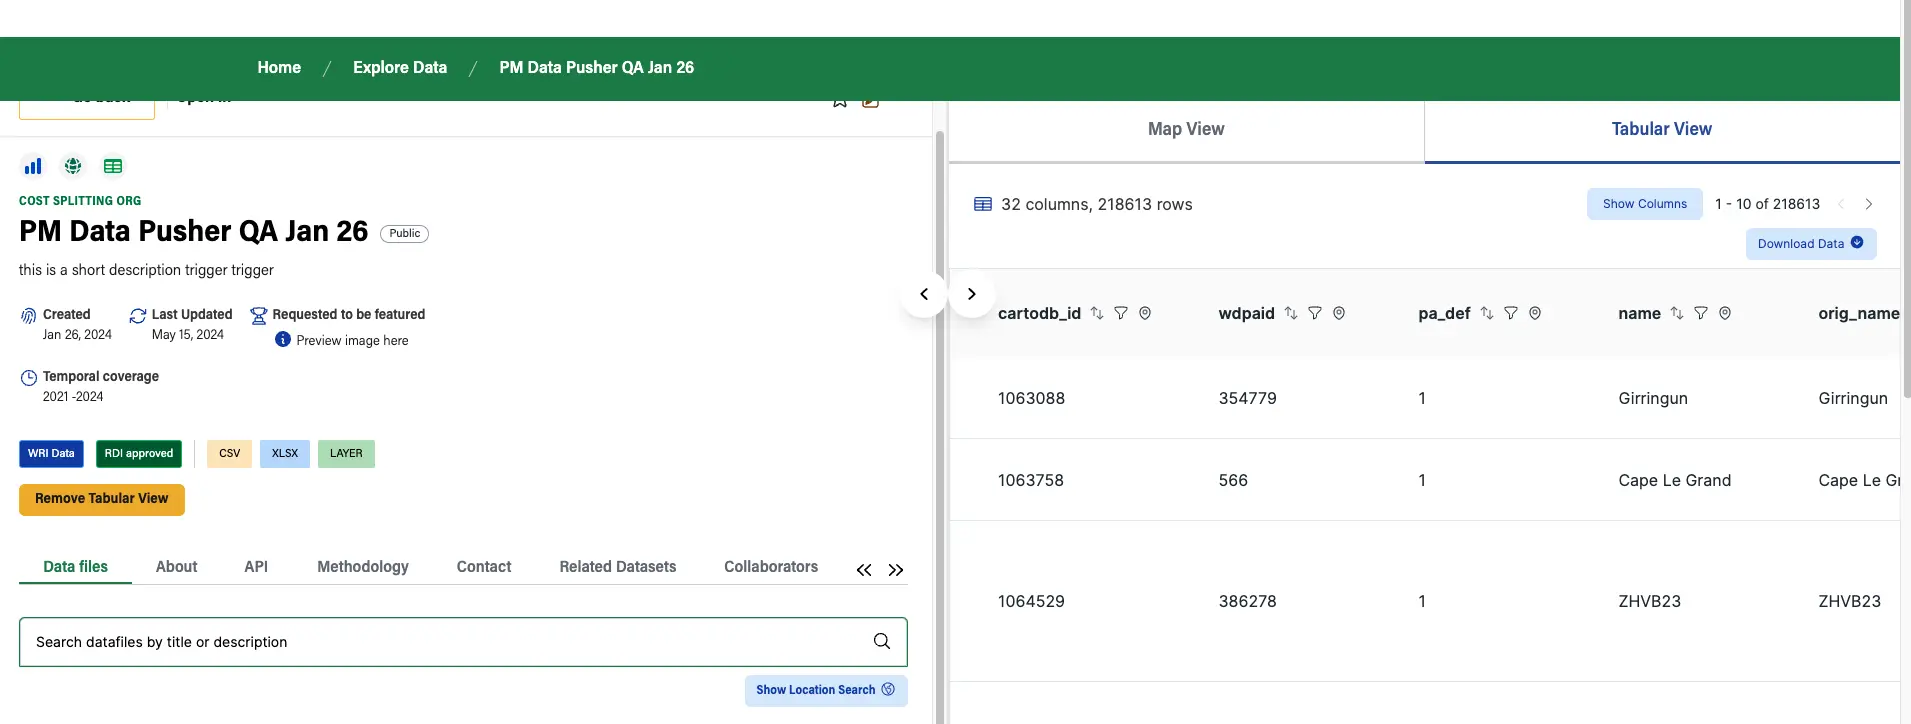
Tabular Previews
The first Data Files in the image above is a tabular Data Files and it has view table preview button, if the button is clicked, the preview section shows the table preview
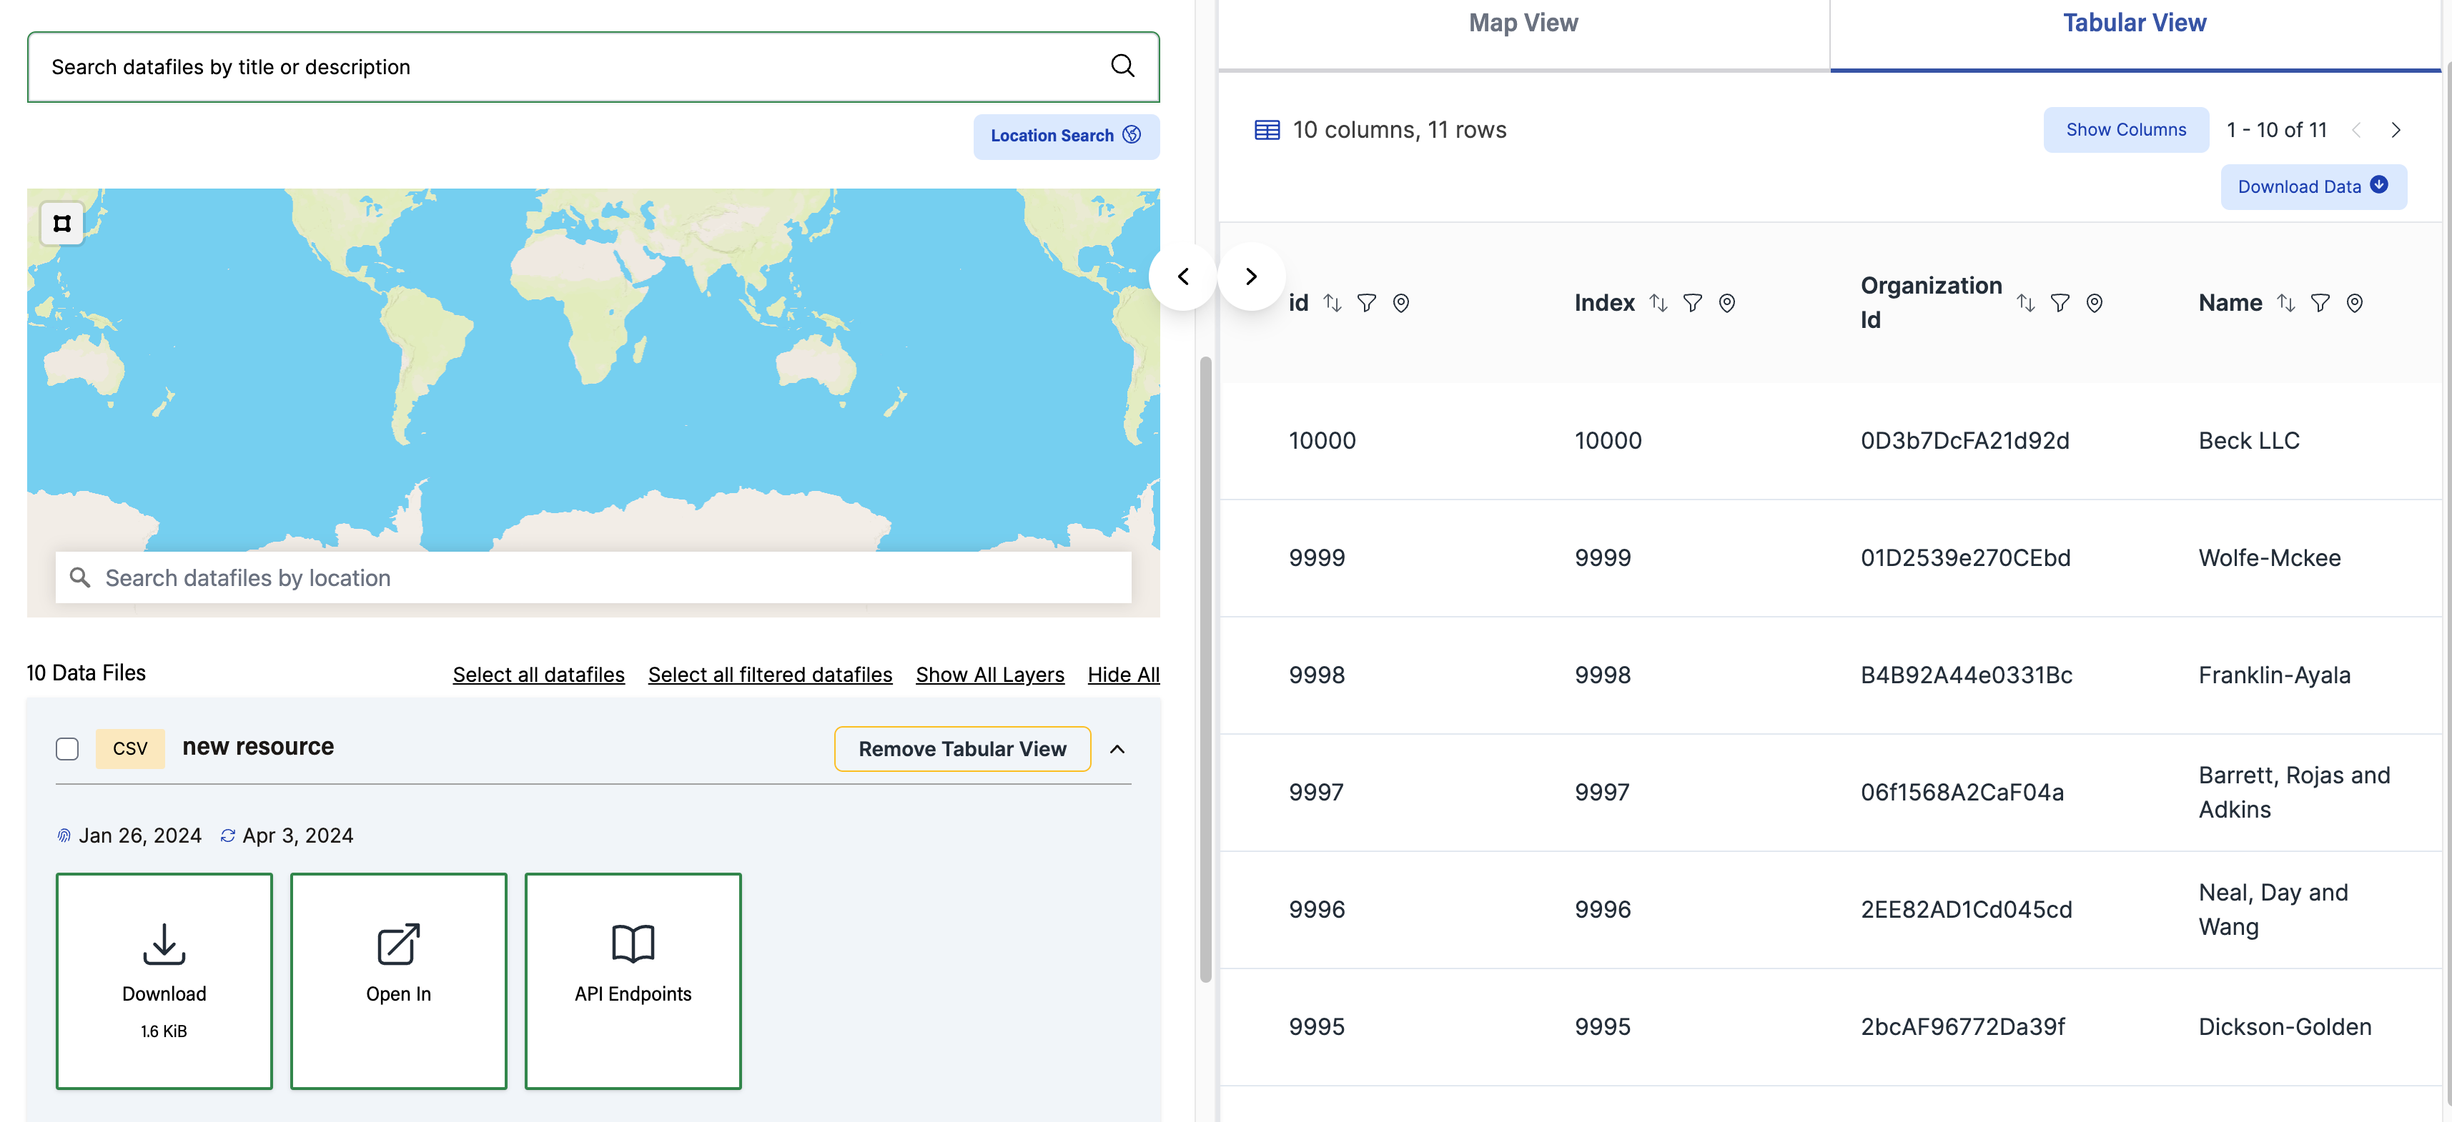
The table contains pagination and also Download data button which allows us to download filtered data.
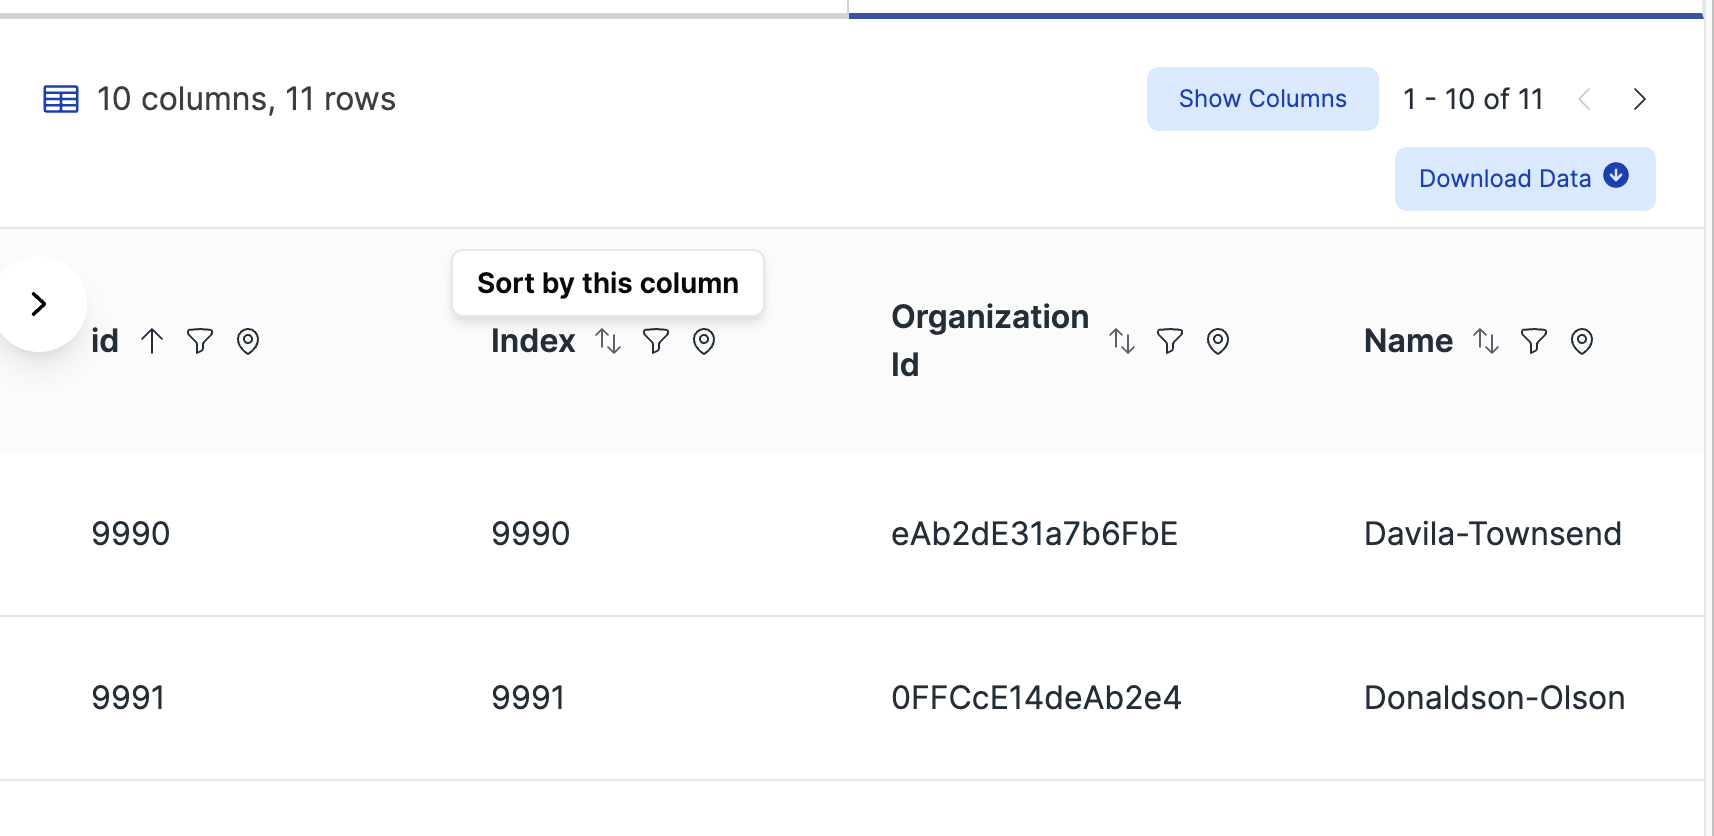
The table also allows us to sort by clicking the arrows in the column both asc and desc
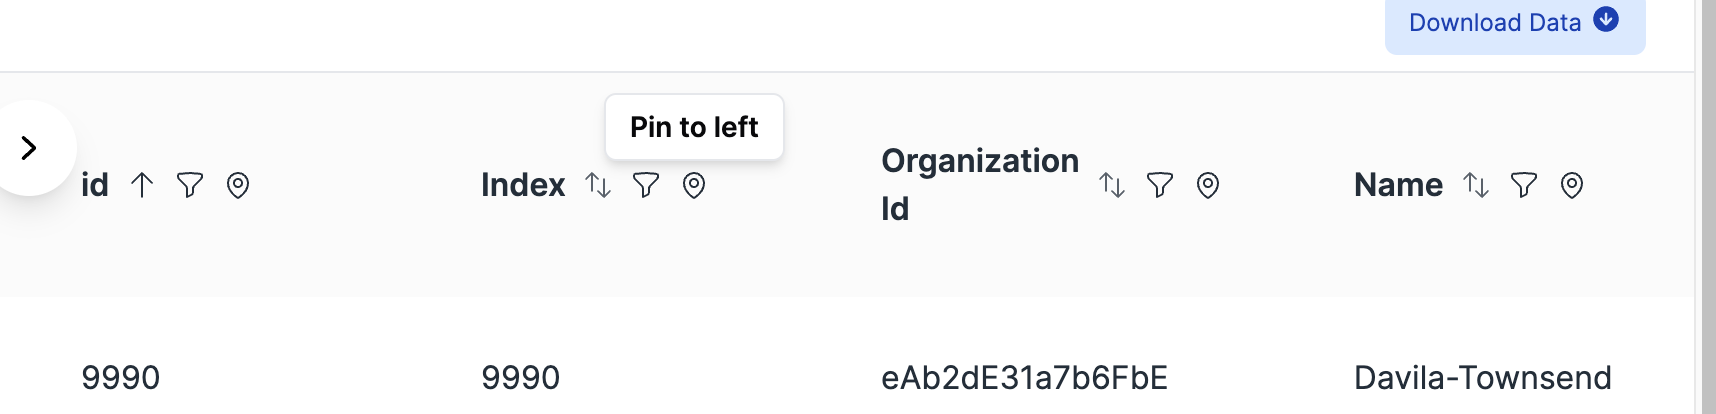
Pin specific column to the left
Hide columns that you do not want to see at that specific moment, click on show Columns and then filter
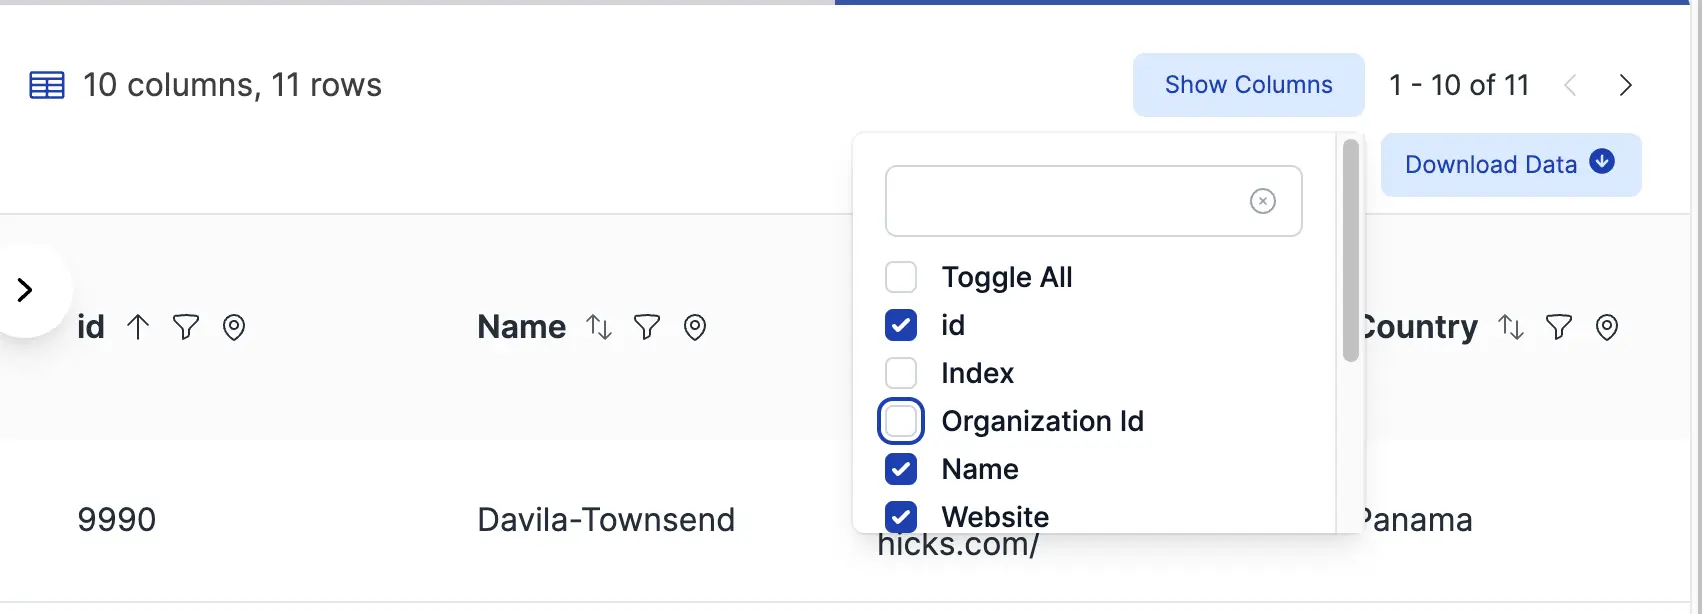
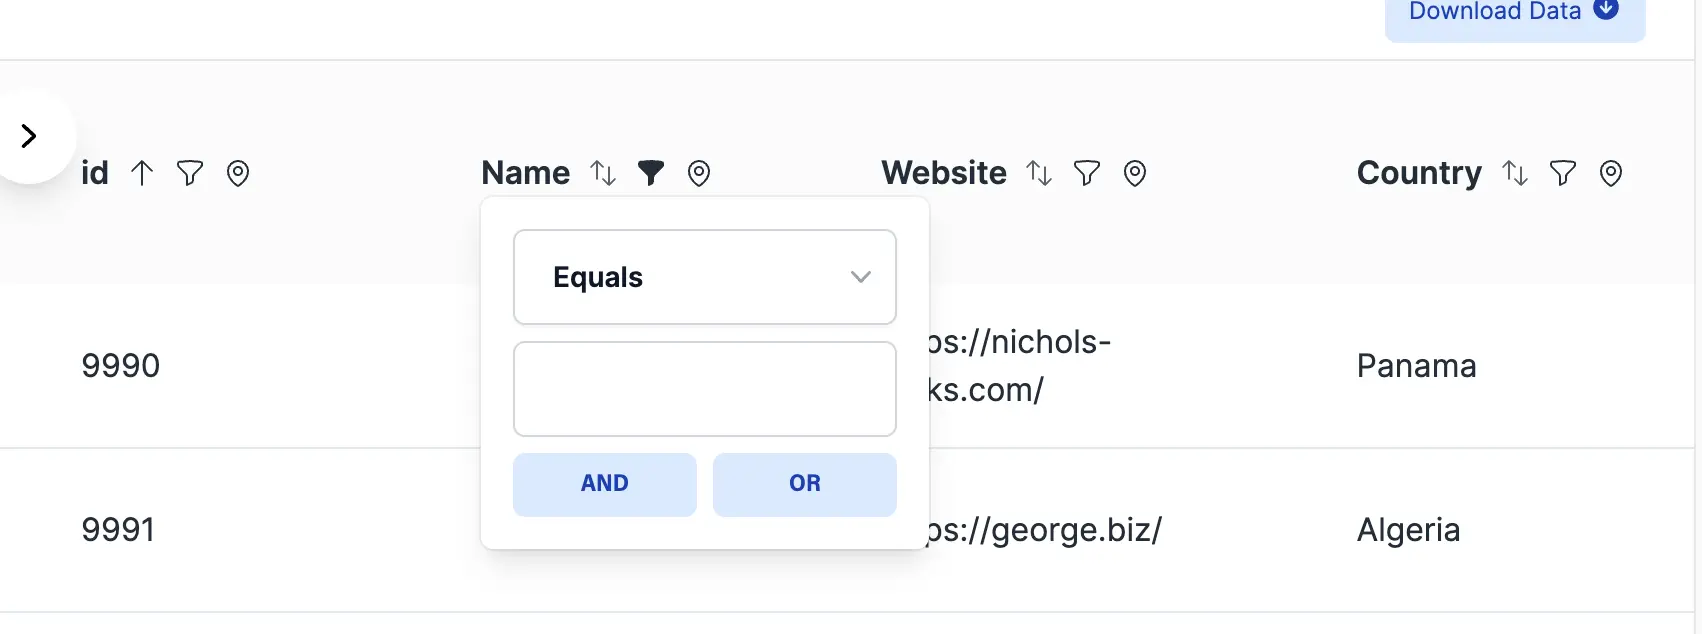
Filter data wherever you like, by clicking in the funnel icon in the column, filters can be removed easily in the top bar
If the column is inferred as a timestamp, then instead of a normal input a date picker will be shown in the filter
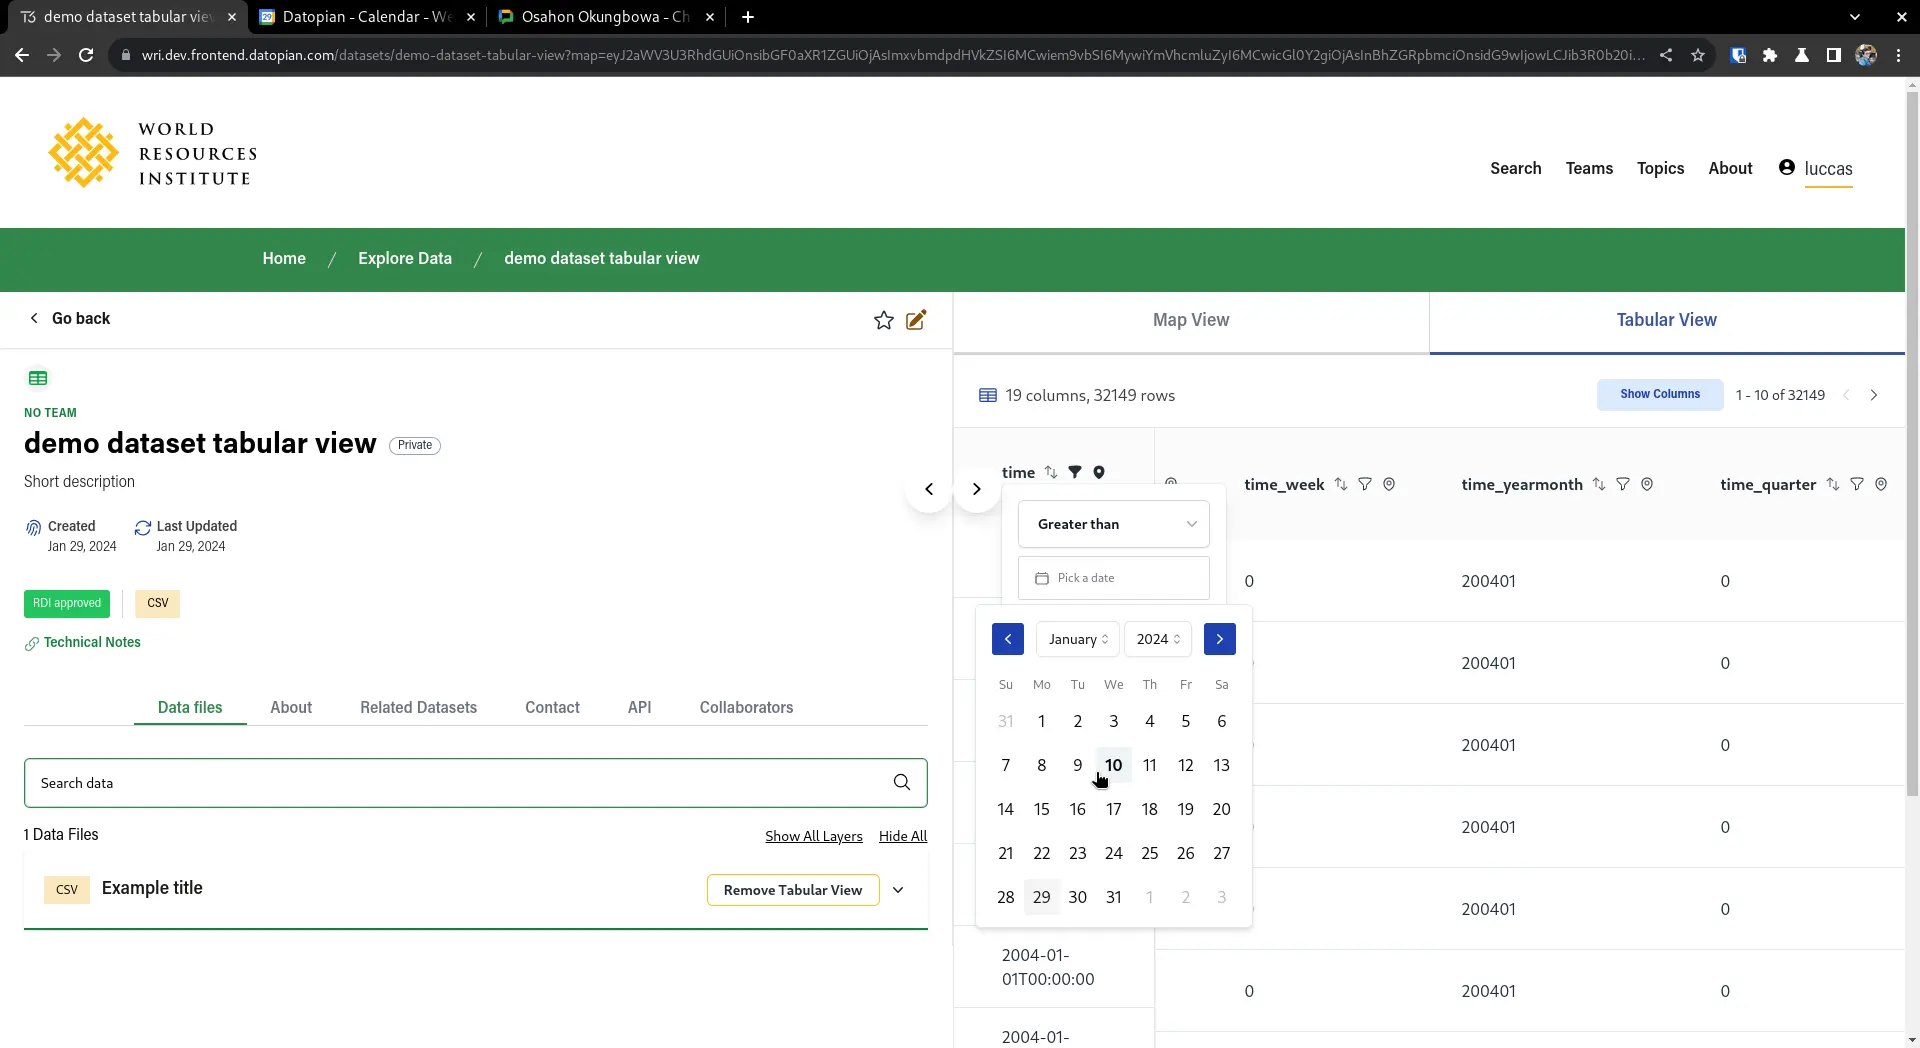
Chart Preview
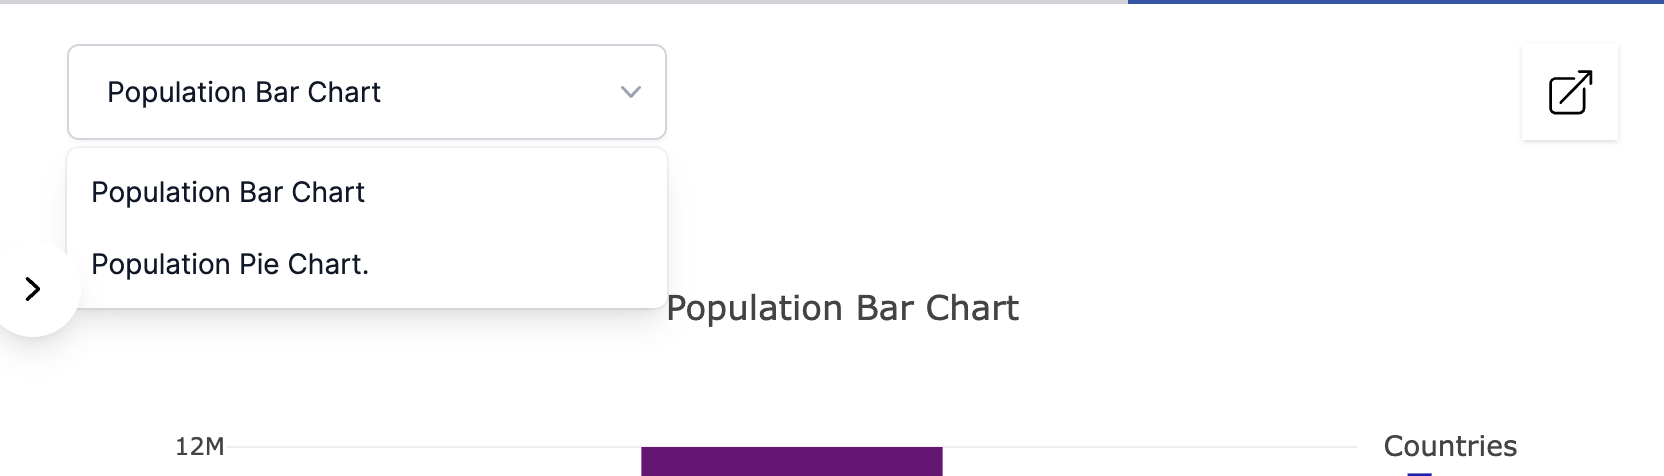
some of the Data Files in the list contain View chart Preview , if clicked it displays the chart preview
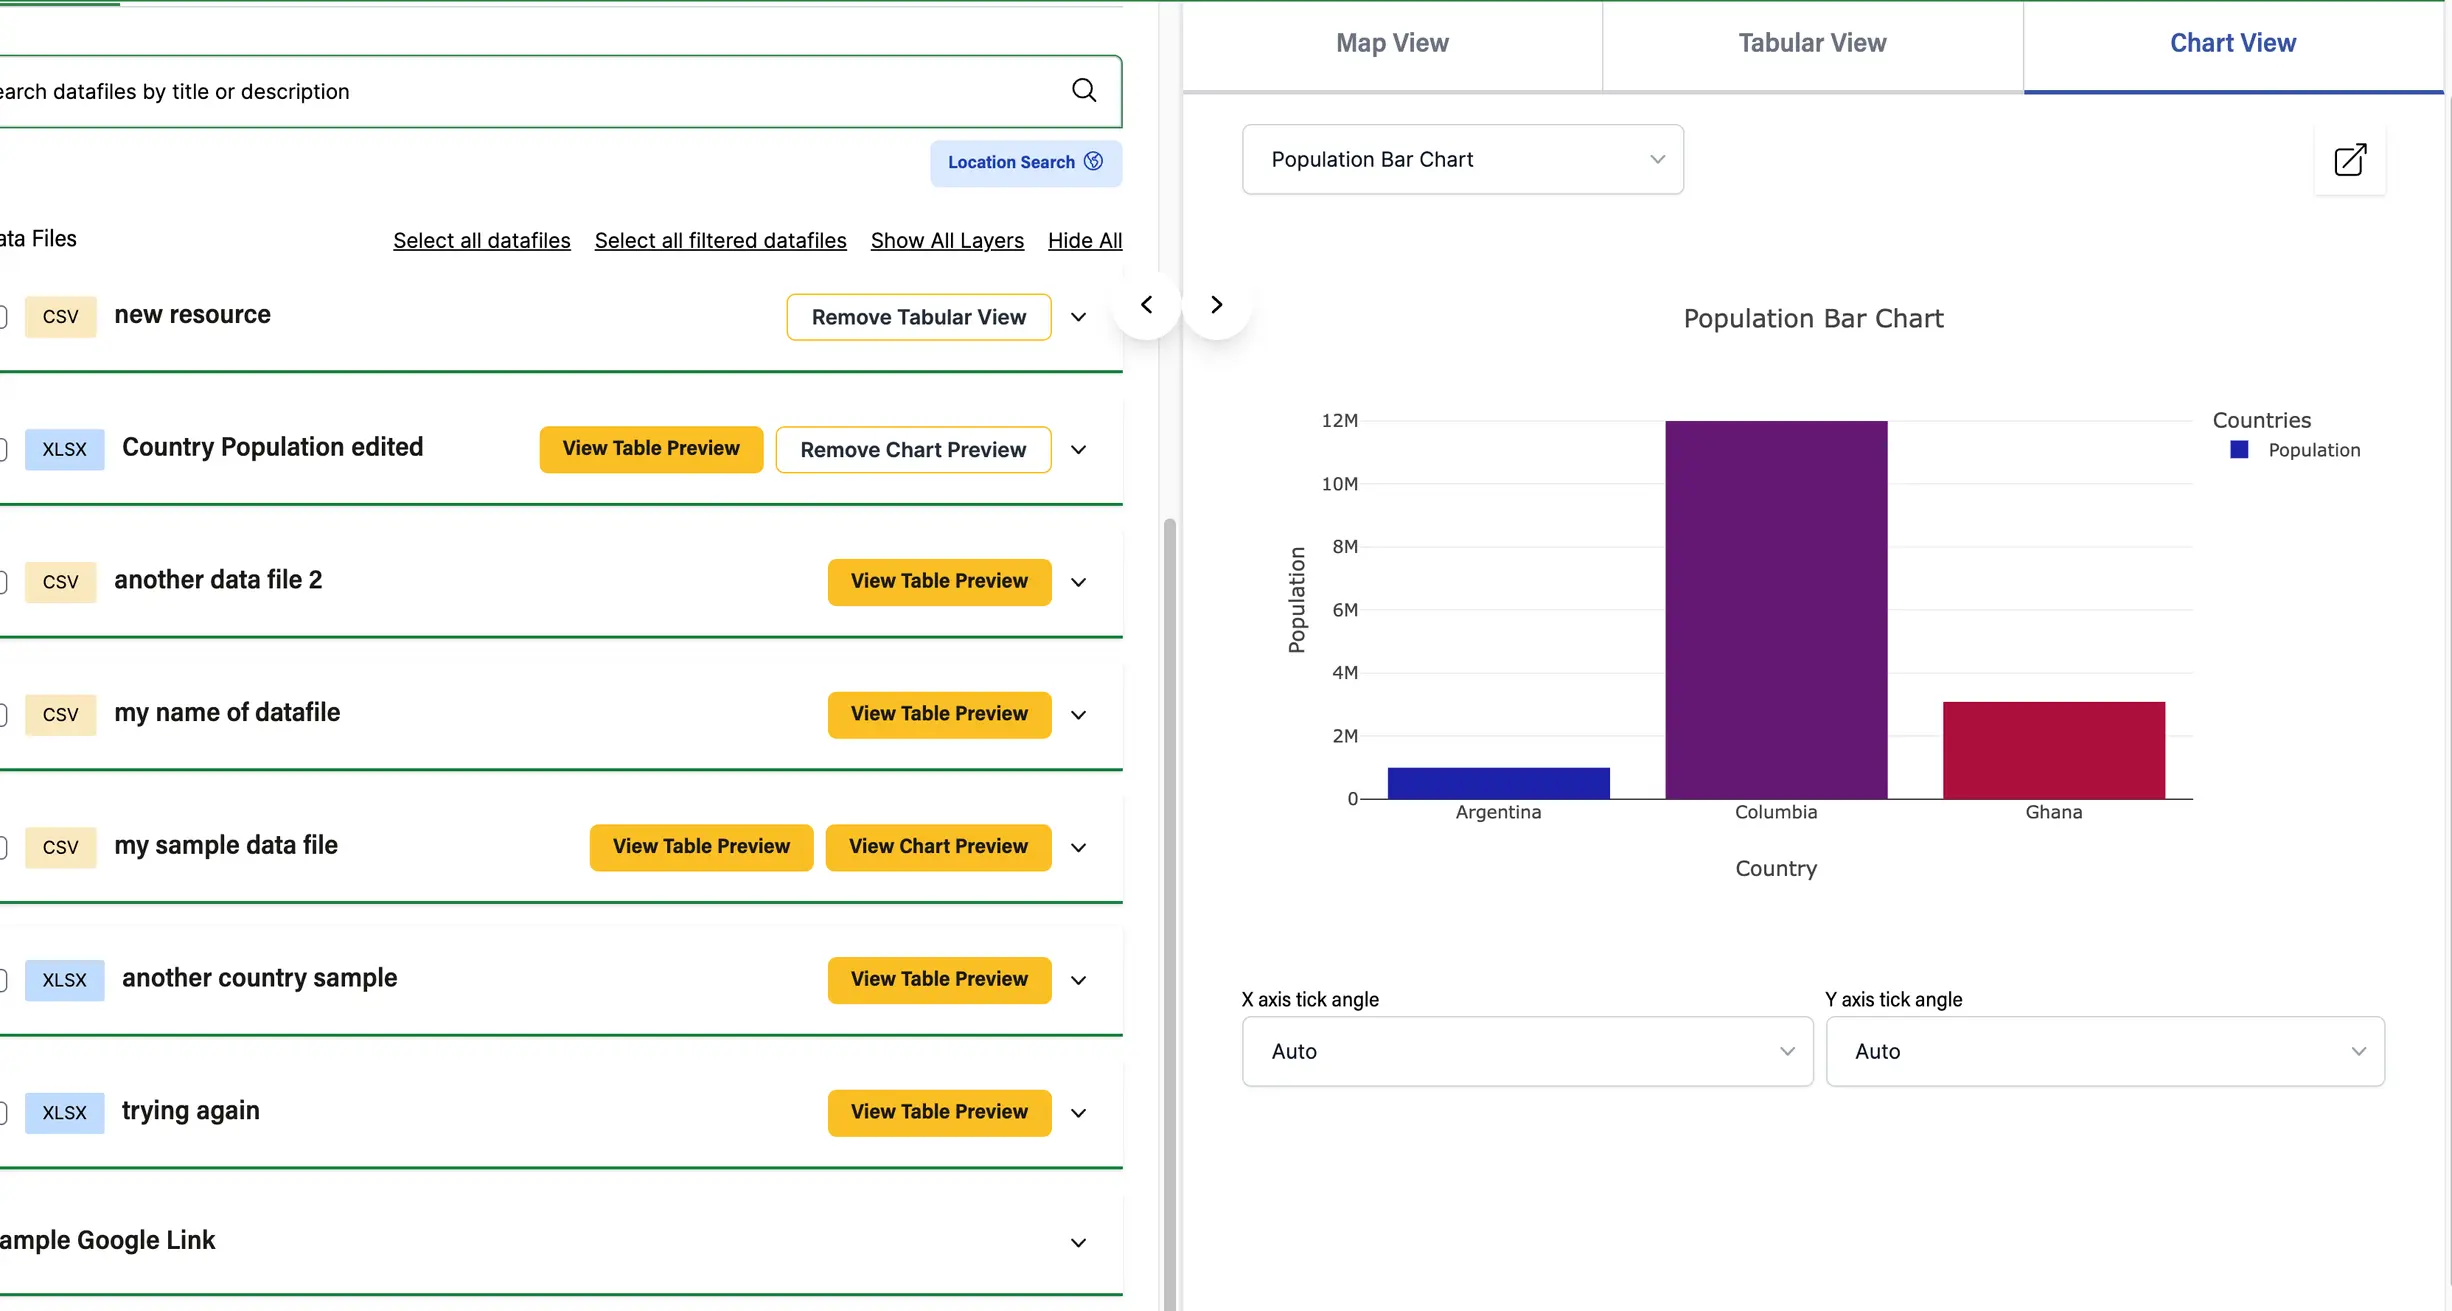
The preview contains a drop-down button has shown below containing list of Predefined chart views.
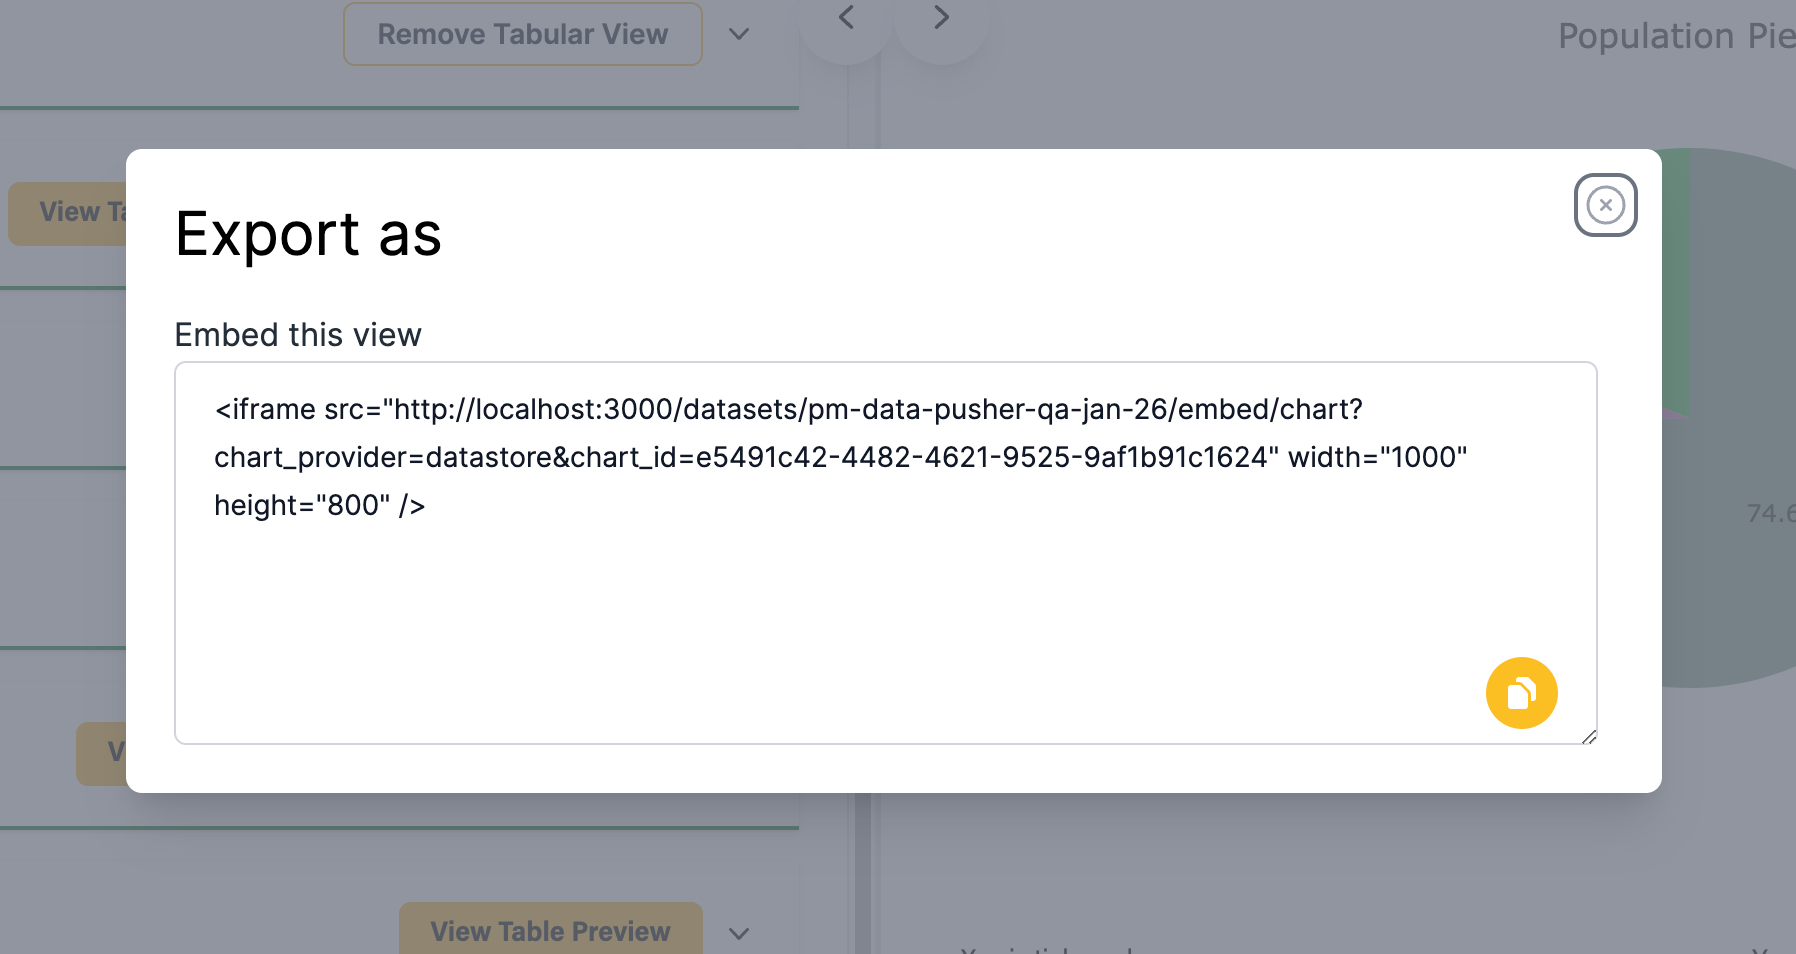
The embed the chart view in a webpage click on the icon in the top right  and then this should pop-up
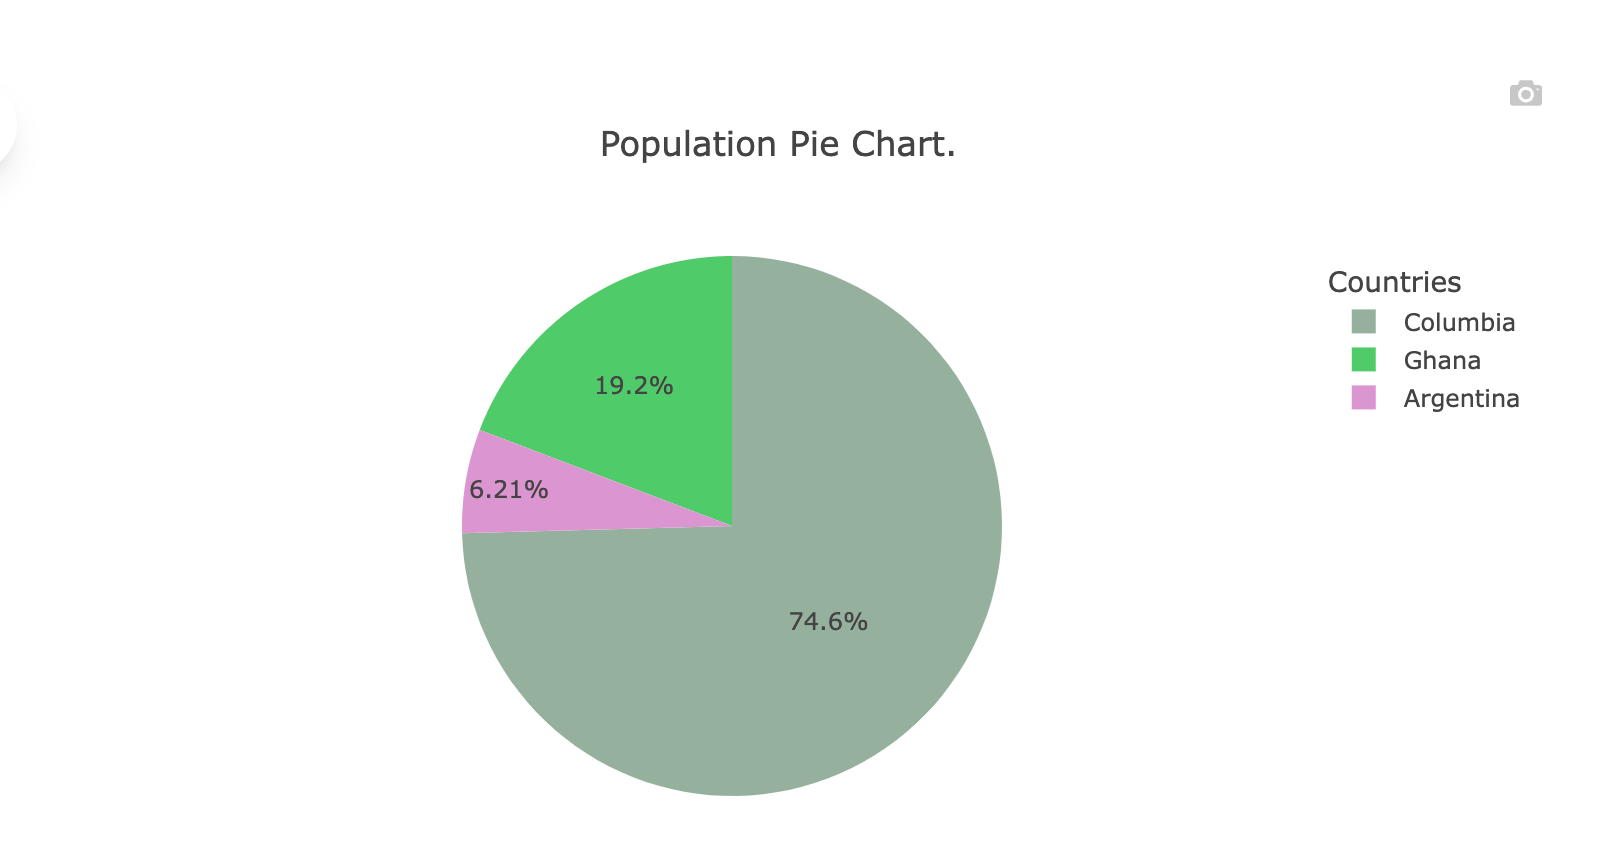
The chart is interactive on hover and you can also take a snapshot of the chart, by clicking on the camera icon in the image below
Map Preview
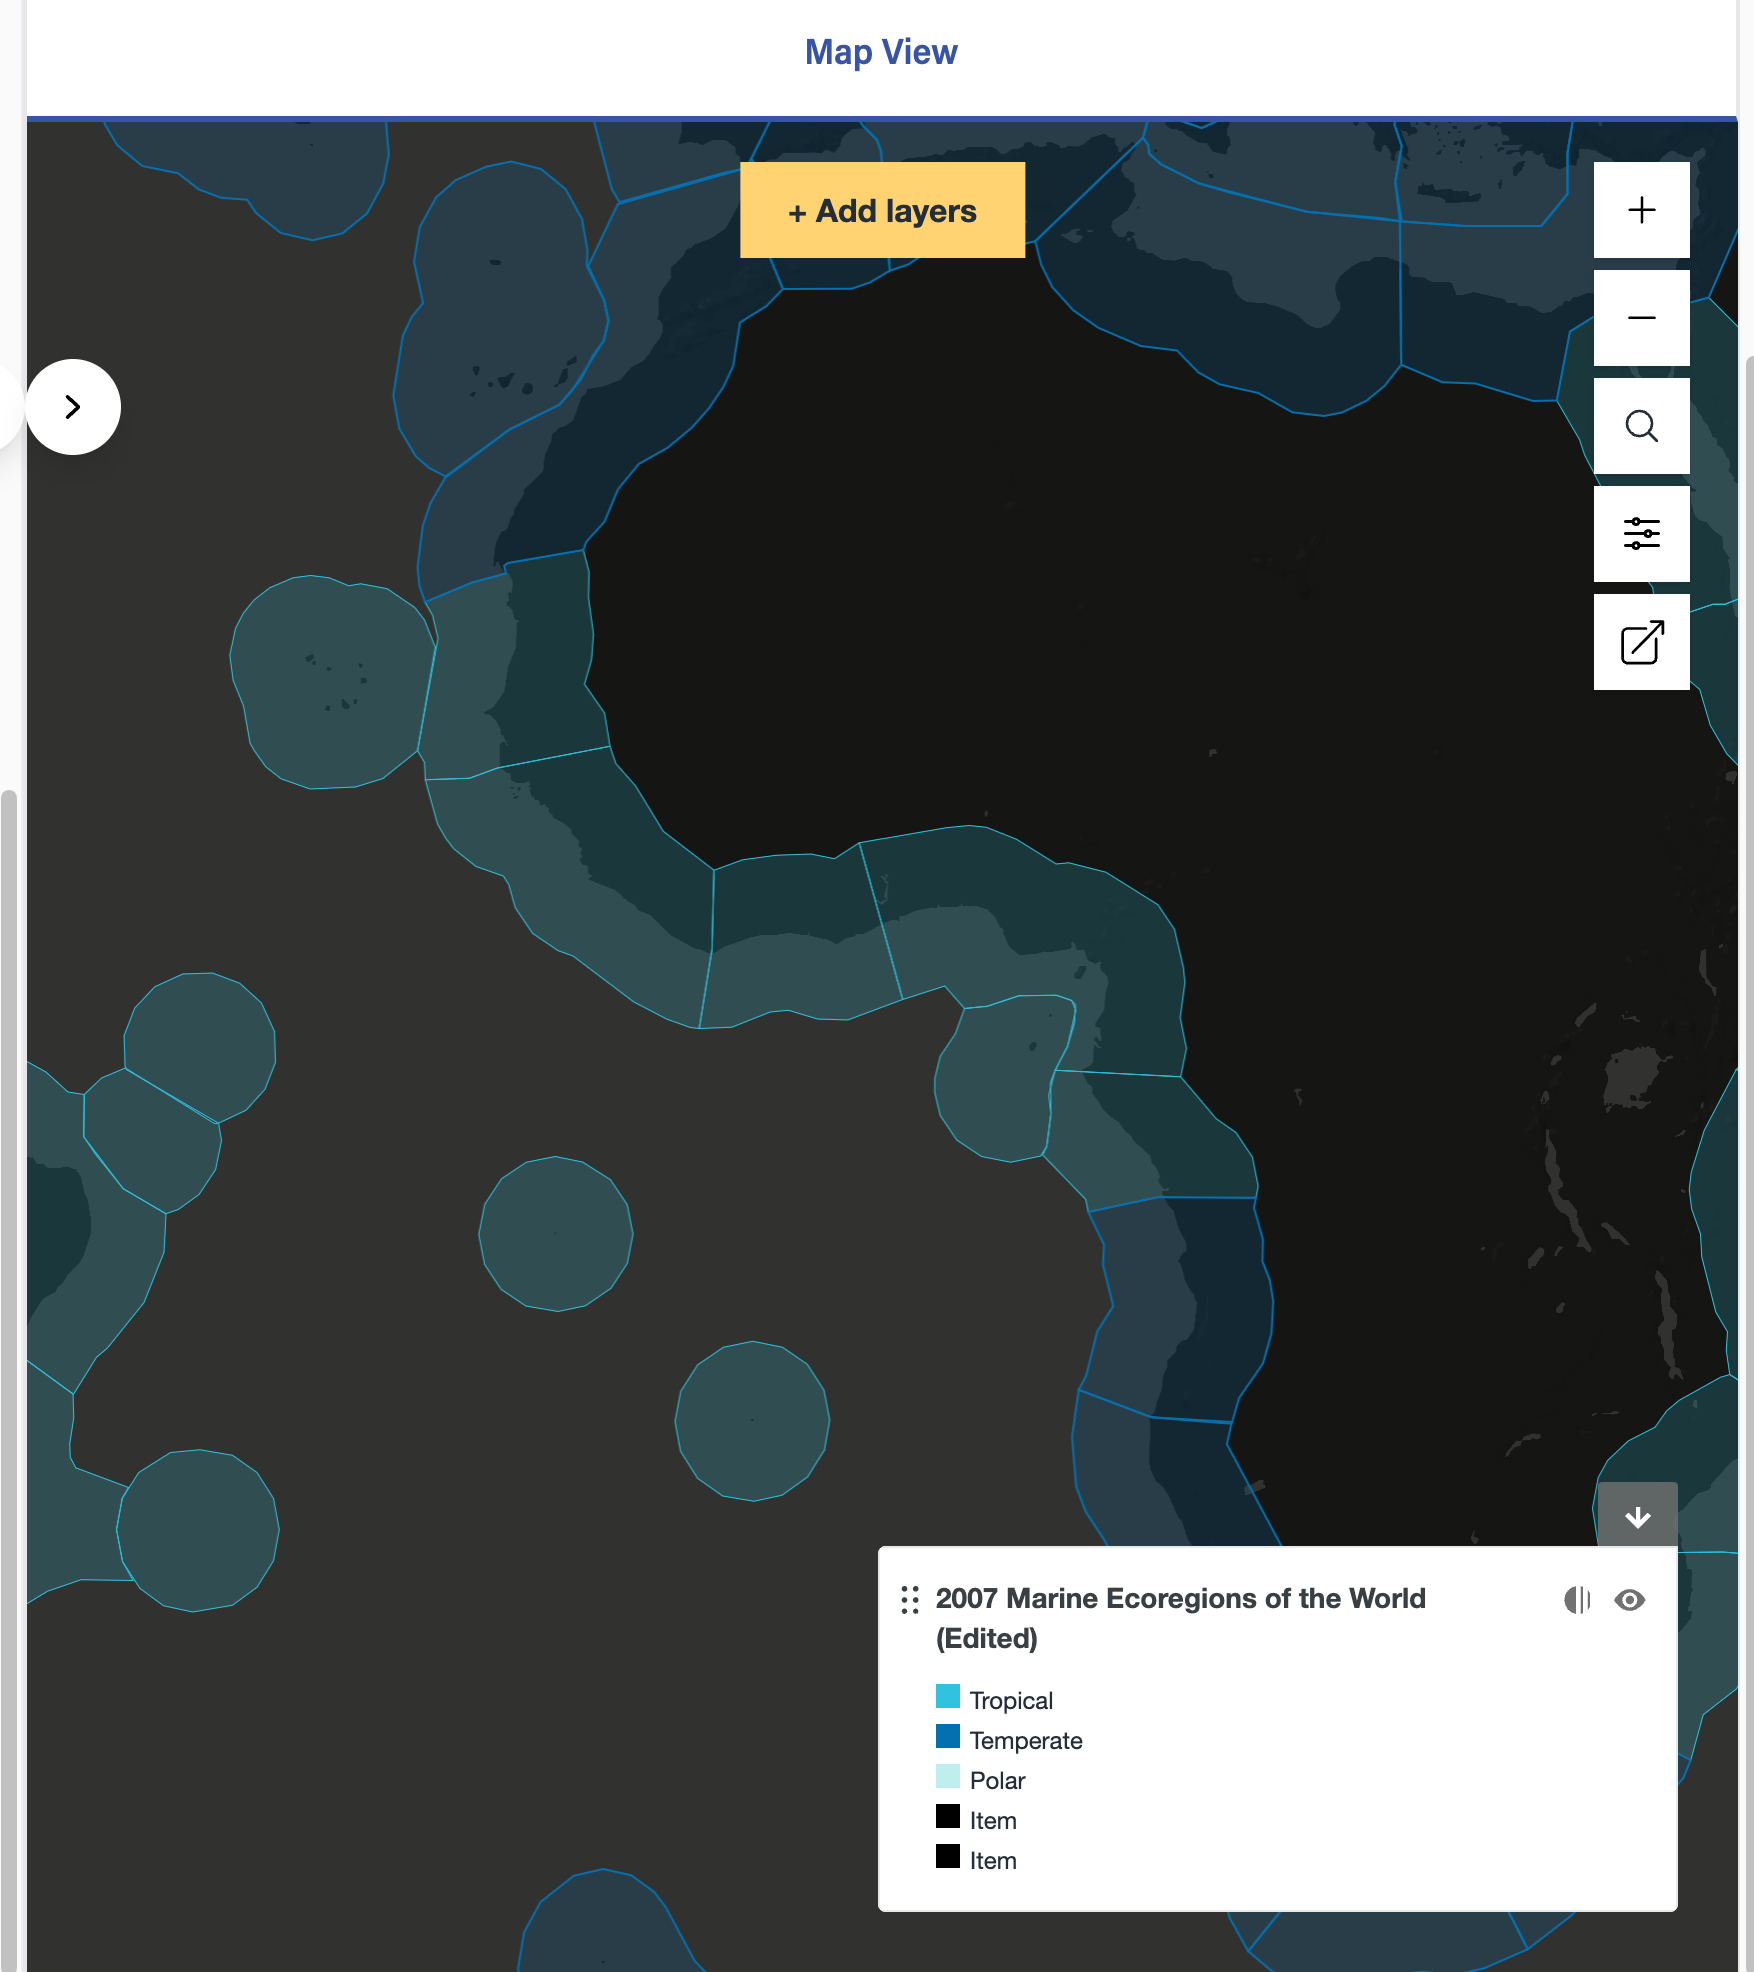
Datasets with geospatial data can be visualized in a feature-rich map on the Dataset page.
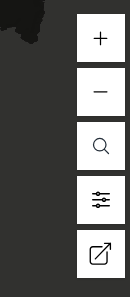
controls
The map has a few controls in the top-right corner.
-
Zoom in
-
Zoom out
-
Geolocation search
-
Map settings
-
Export as
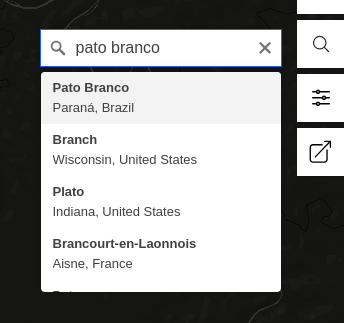
Geolocation search
Geolocation search allows users to provide the name of a city, state or country and make the map navigate to it.
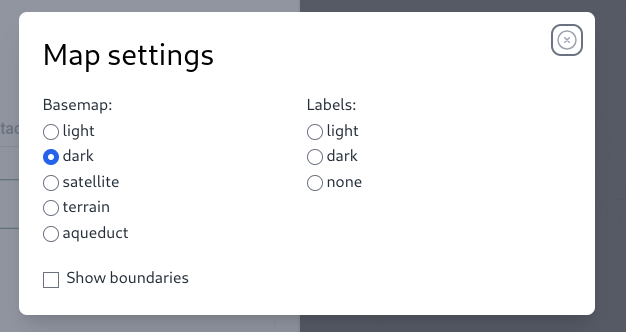
Map settings
The map settings control allows users to change some visualization settings of the map, including the style of the basemap and labels and whether boundaries should be shown or hidden.
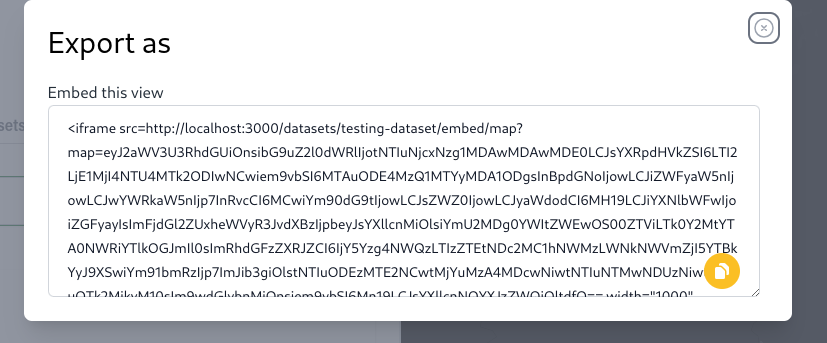
Export as
The export as control allows users to export the map as an embedding.
Legends
It provides some extra functionality to the maps. Some of the features are:
-
Display layer metadata such as the title
-
Render legends, that could be "choropleth", "gradient", "basic", "proportional" or "multiple" (for multiple legends)
-
Reorder layers
-
Hide layers
-
Change layer opacity
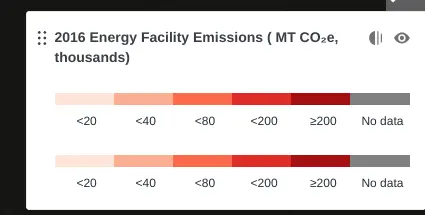
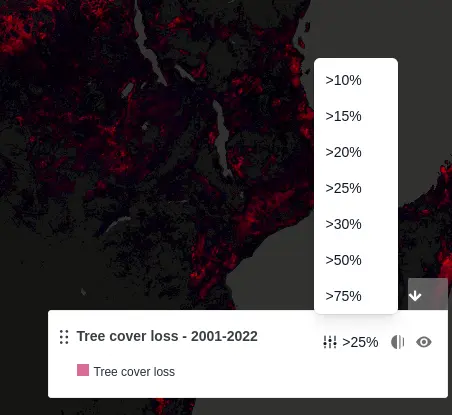
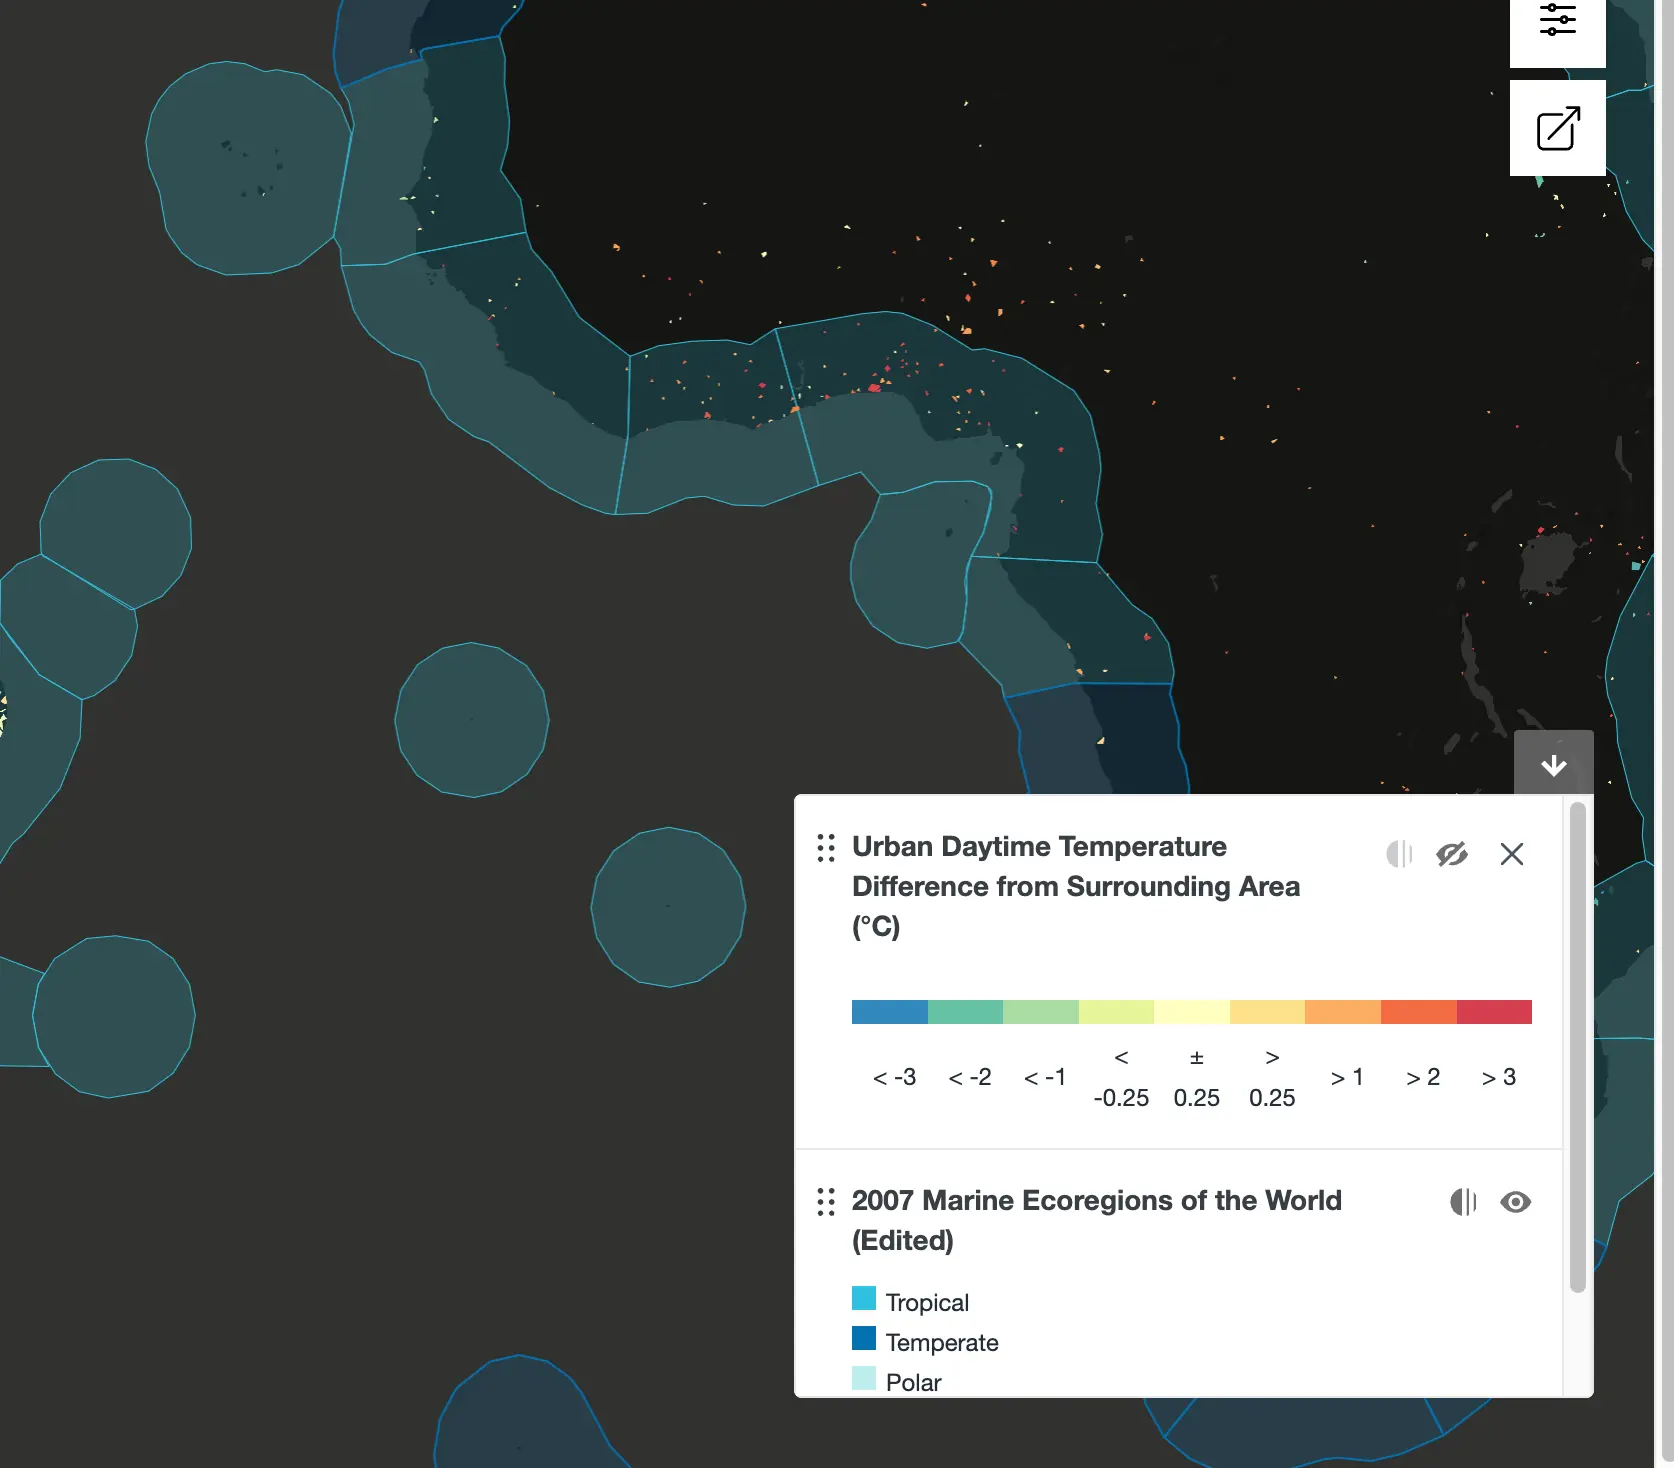
Thresholds
Some layers may contain different threshold. In this case, a new select will be shown on the legends allowing the threshold value to be changed:
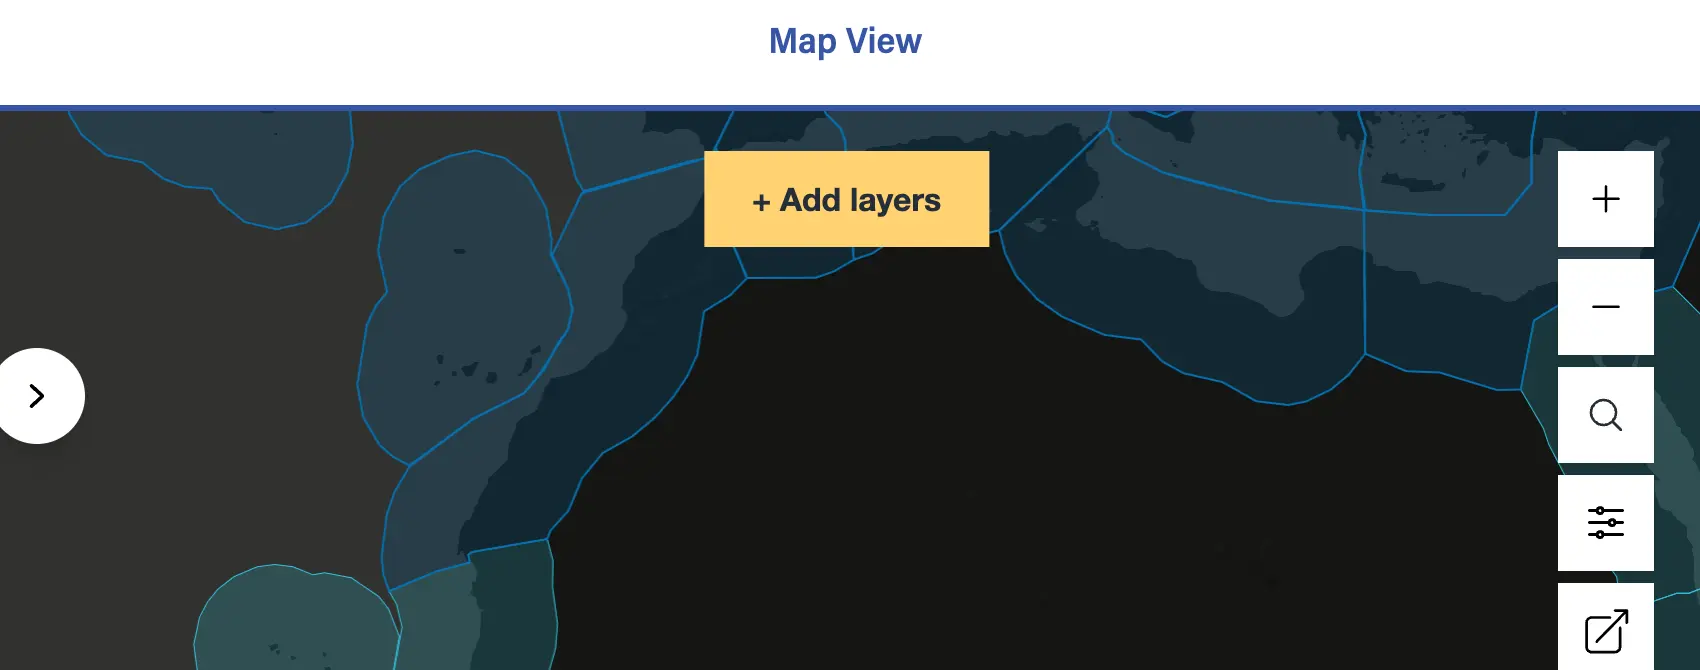
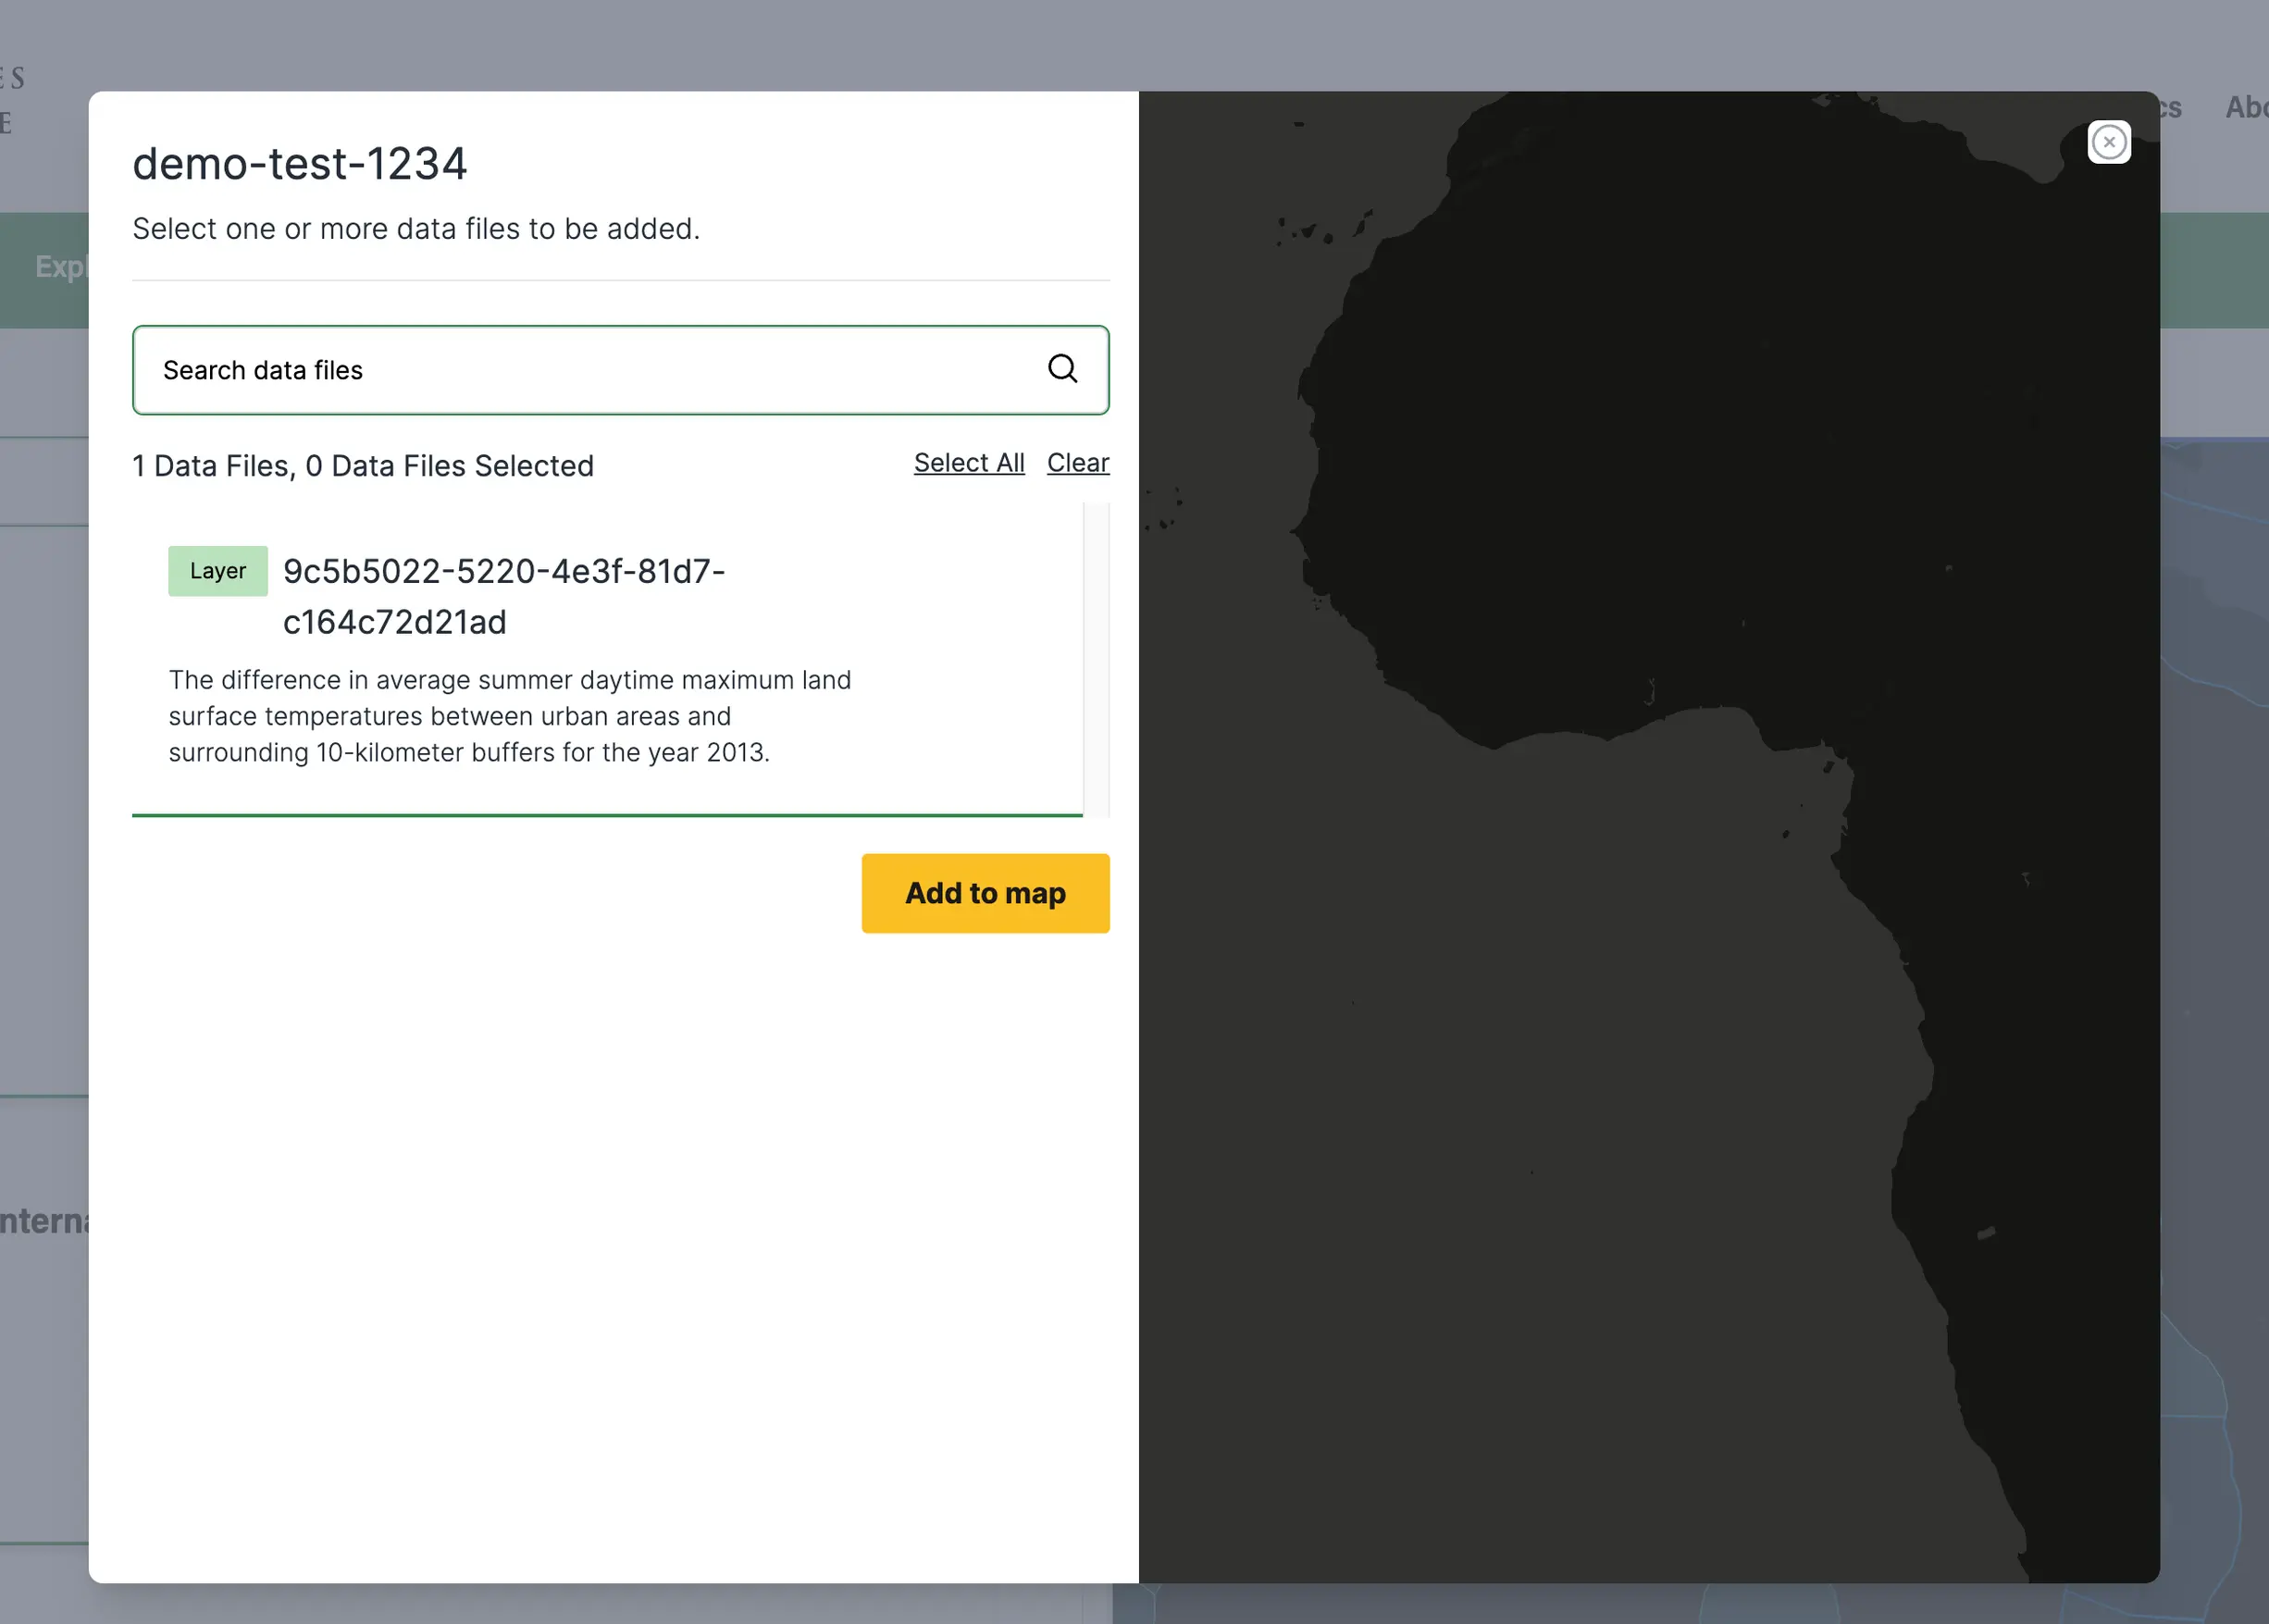
Add layers from other Datasets
The ma view has Add layers to add layer from other Datasets
on clicked it displays list of some associated Datasets,
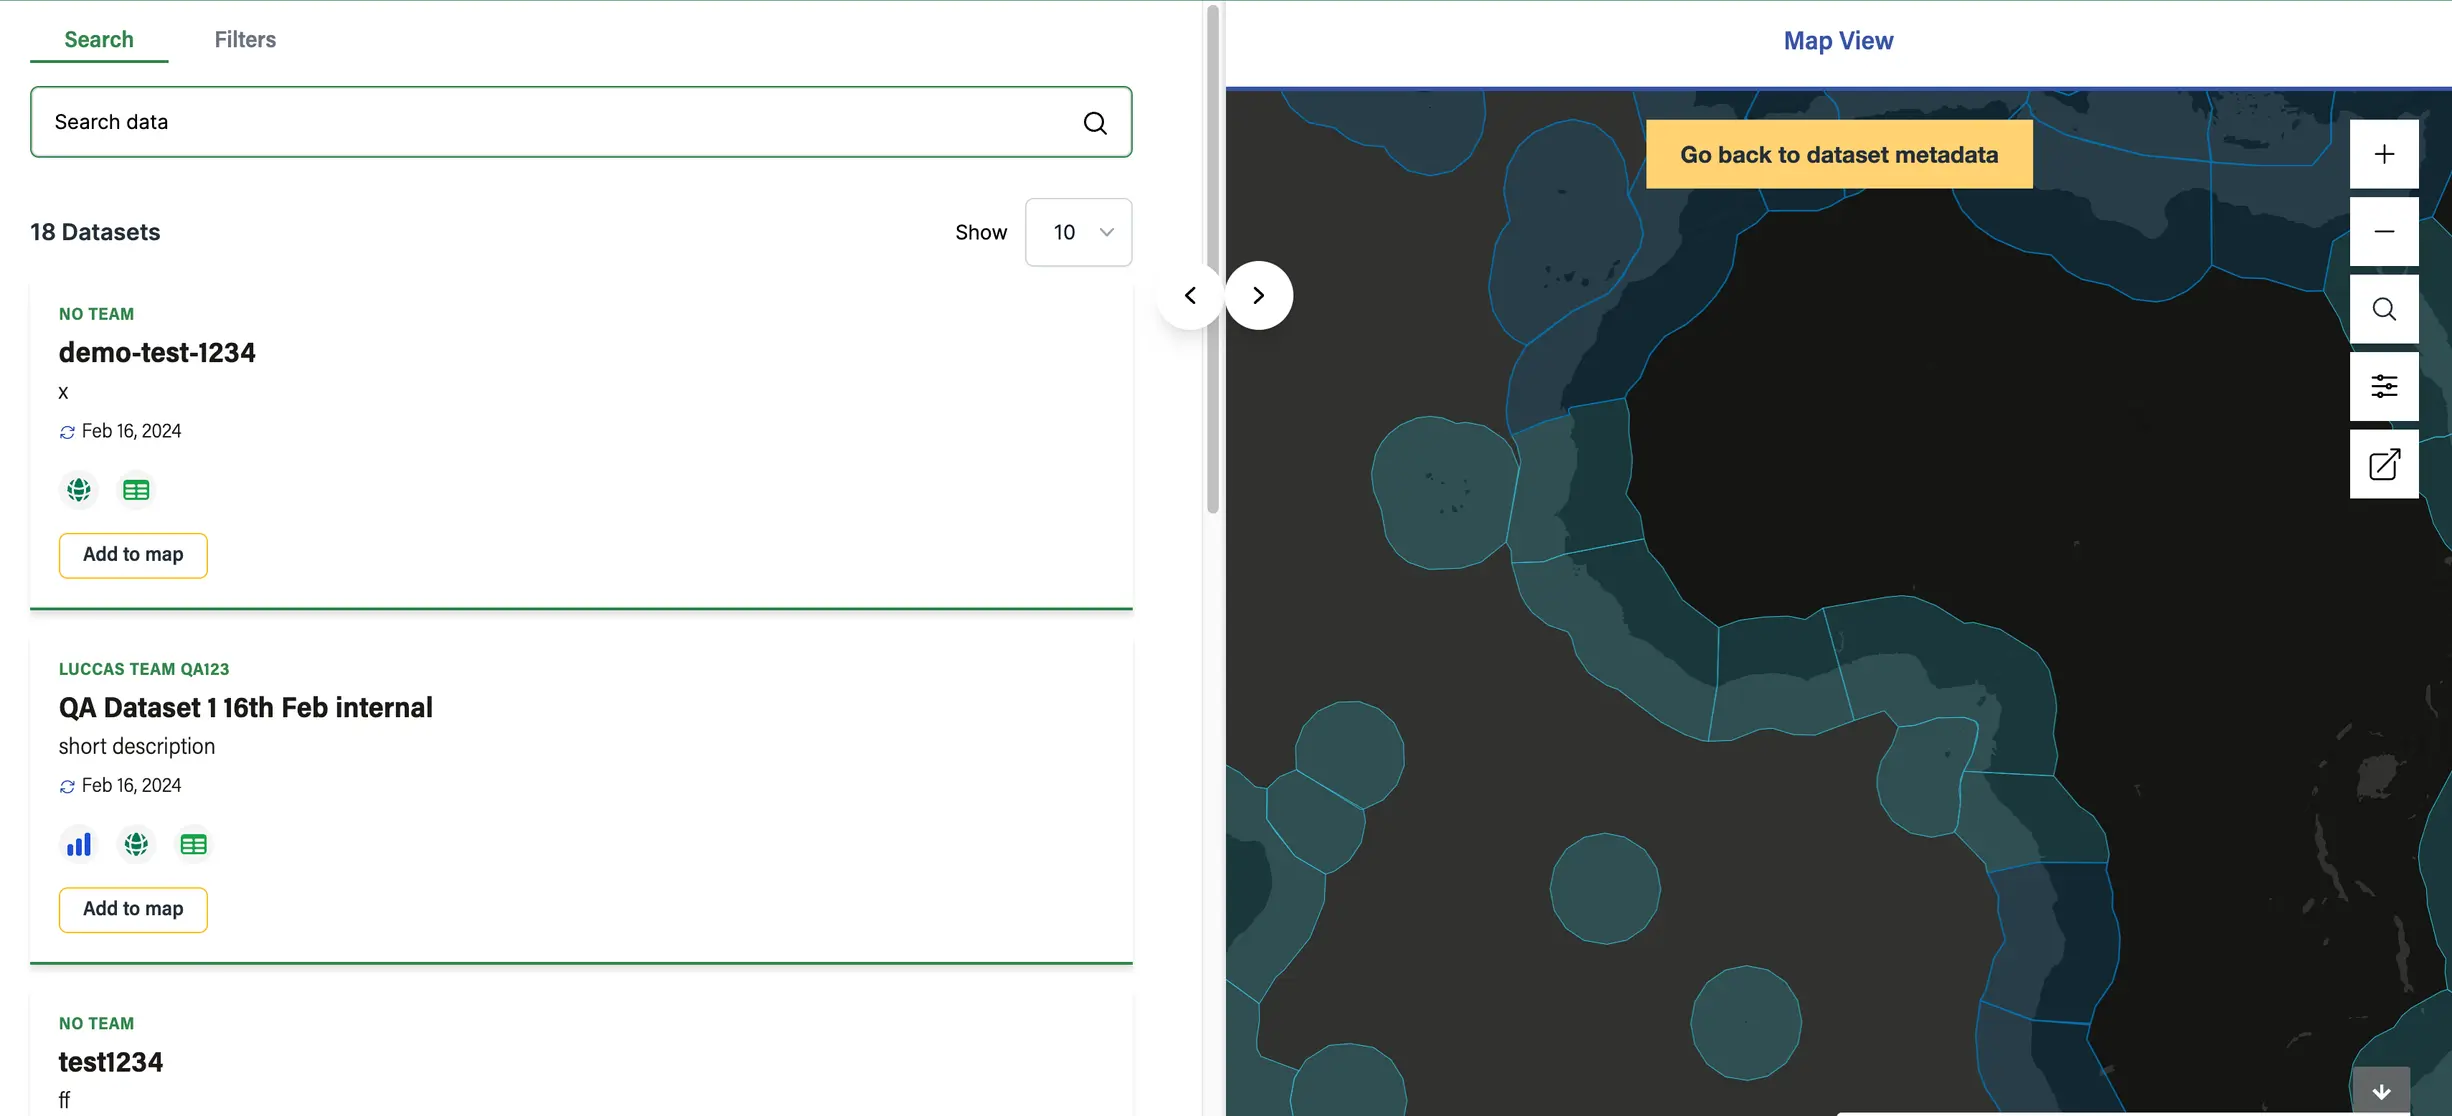
if you click on Add to map on the selected Dataset, the pop-up appeared has shown below
now if you clicked on Add to map again the Dataset map view will be layered with the previous view we have
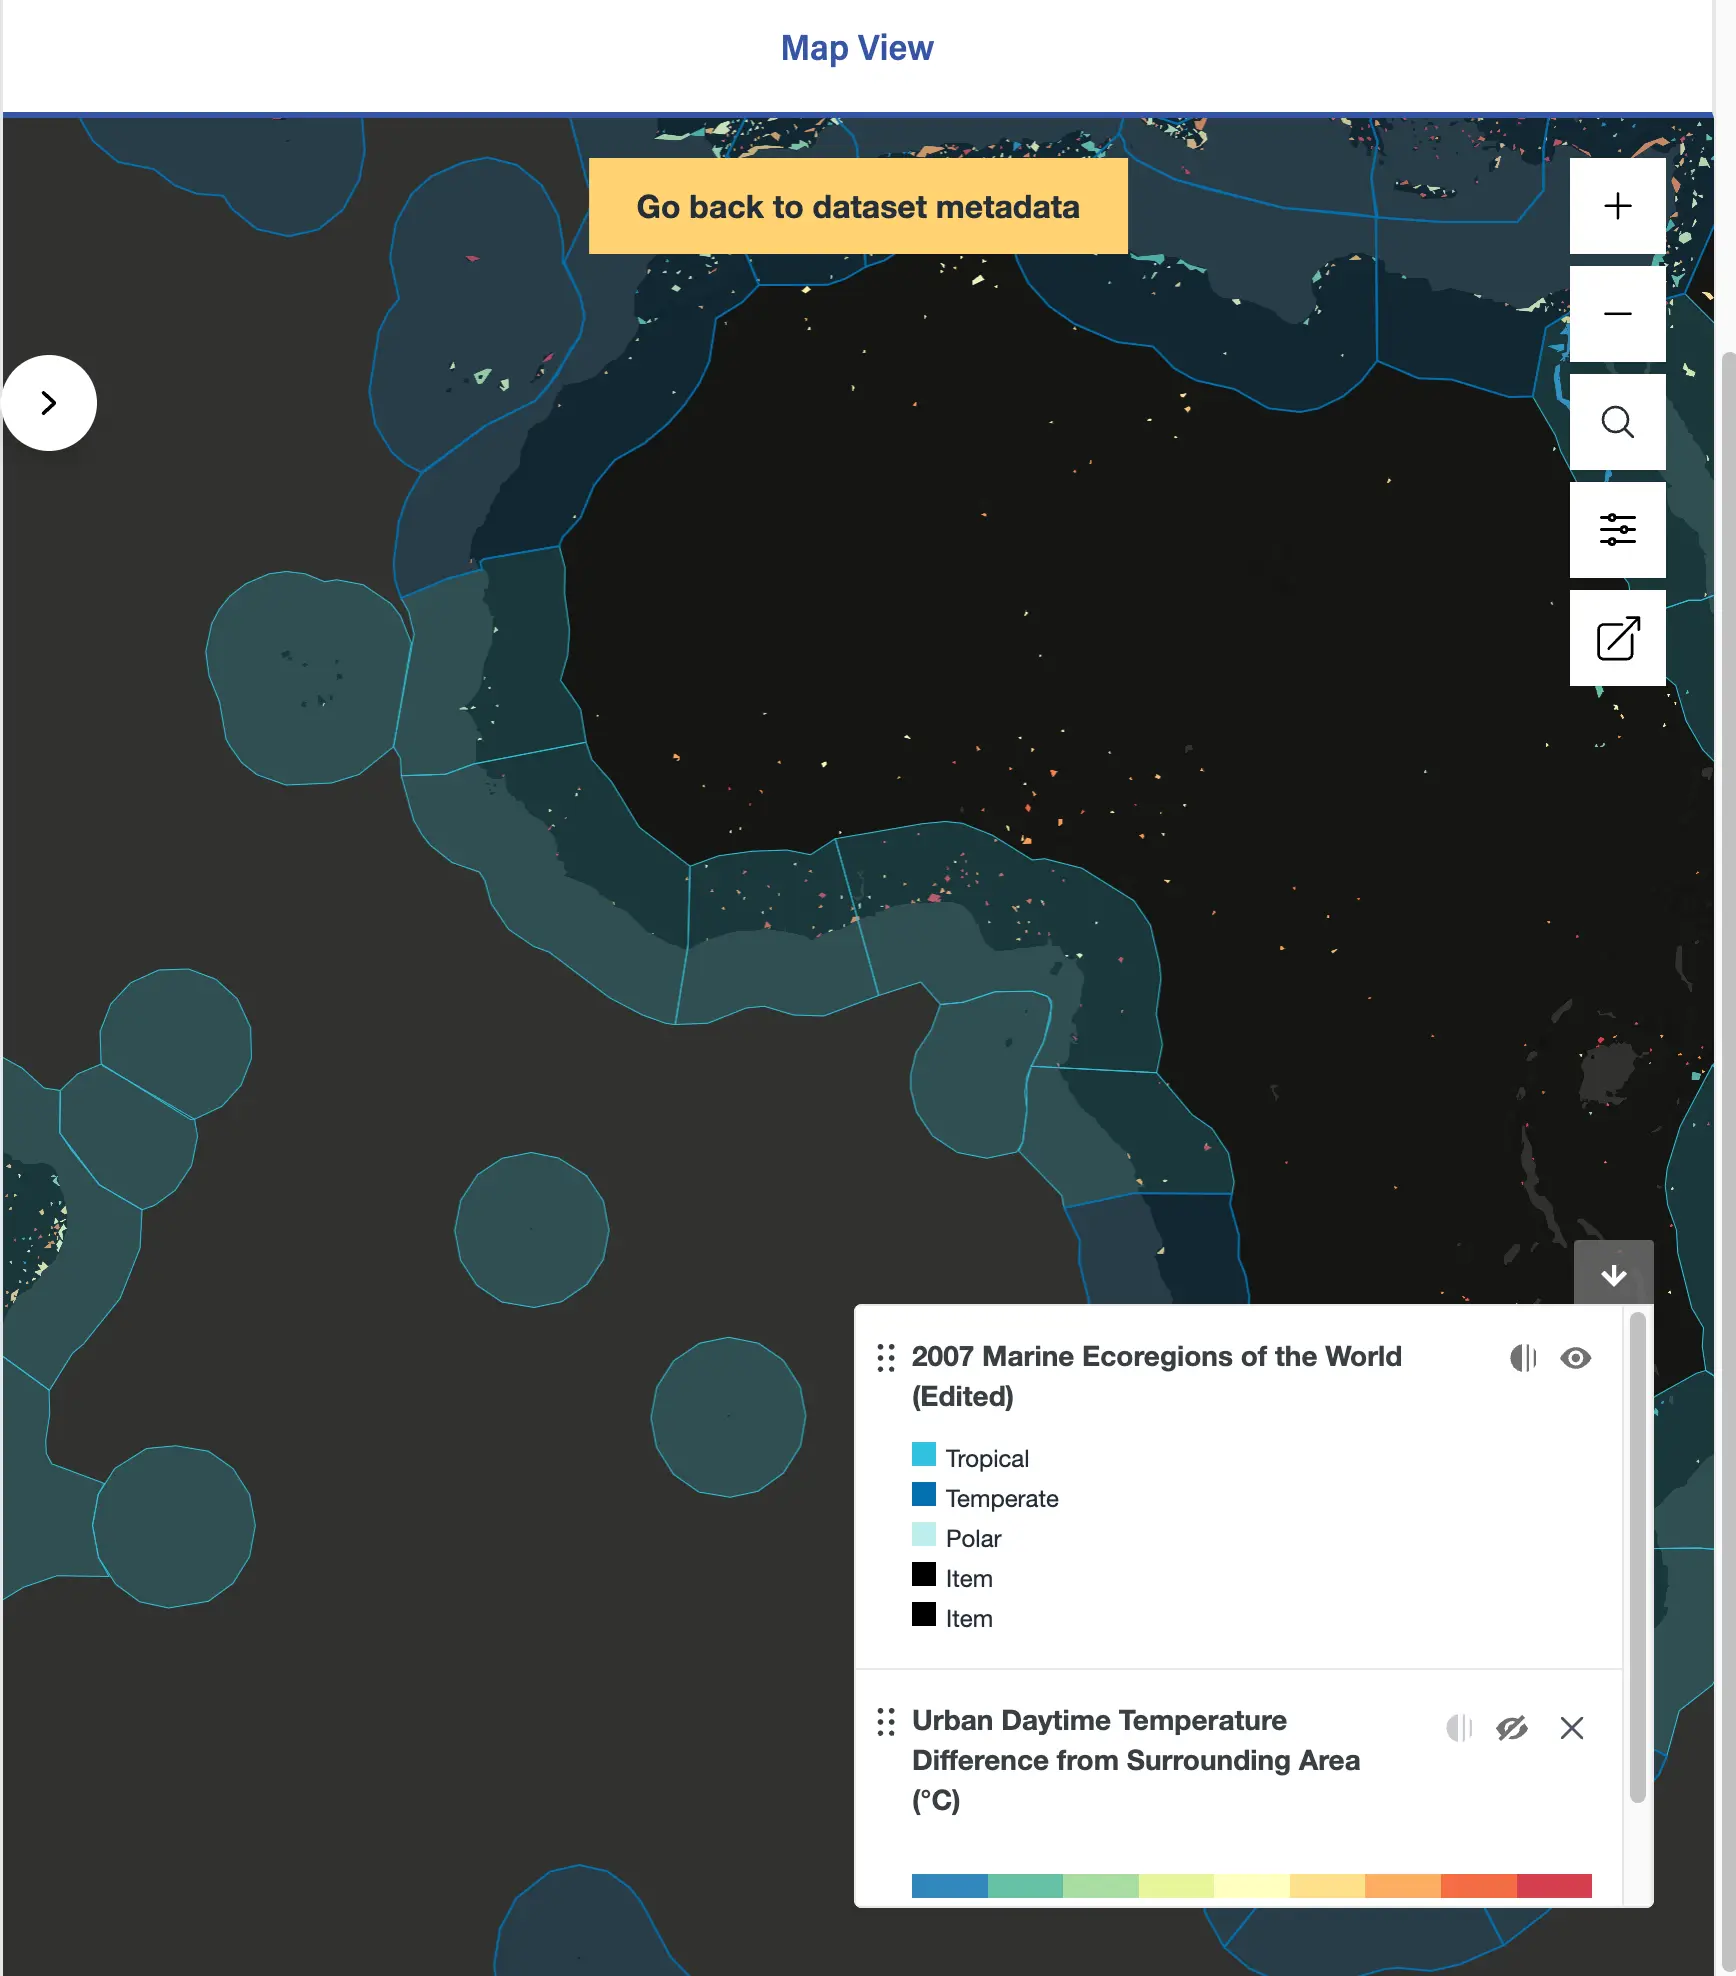
As you can see we now have two layer views and we can see the legends at the bottom right. This legend can be reordered which also affects how the layers are layered on top of each other
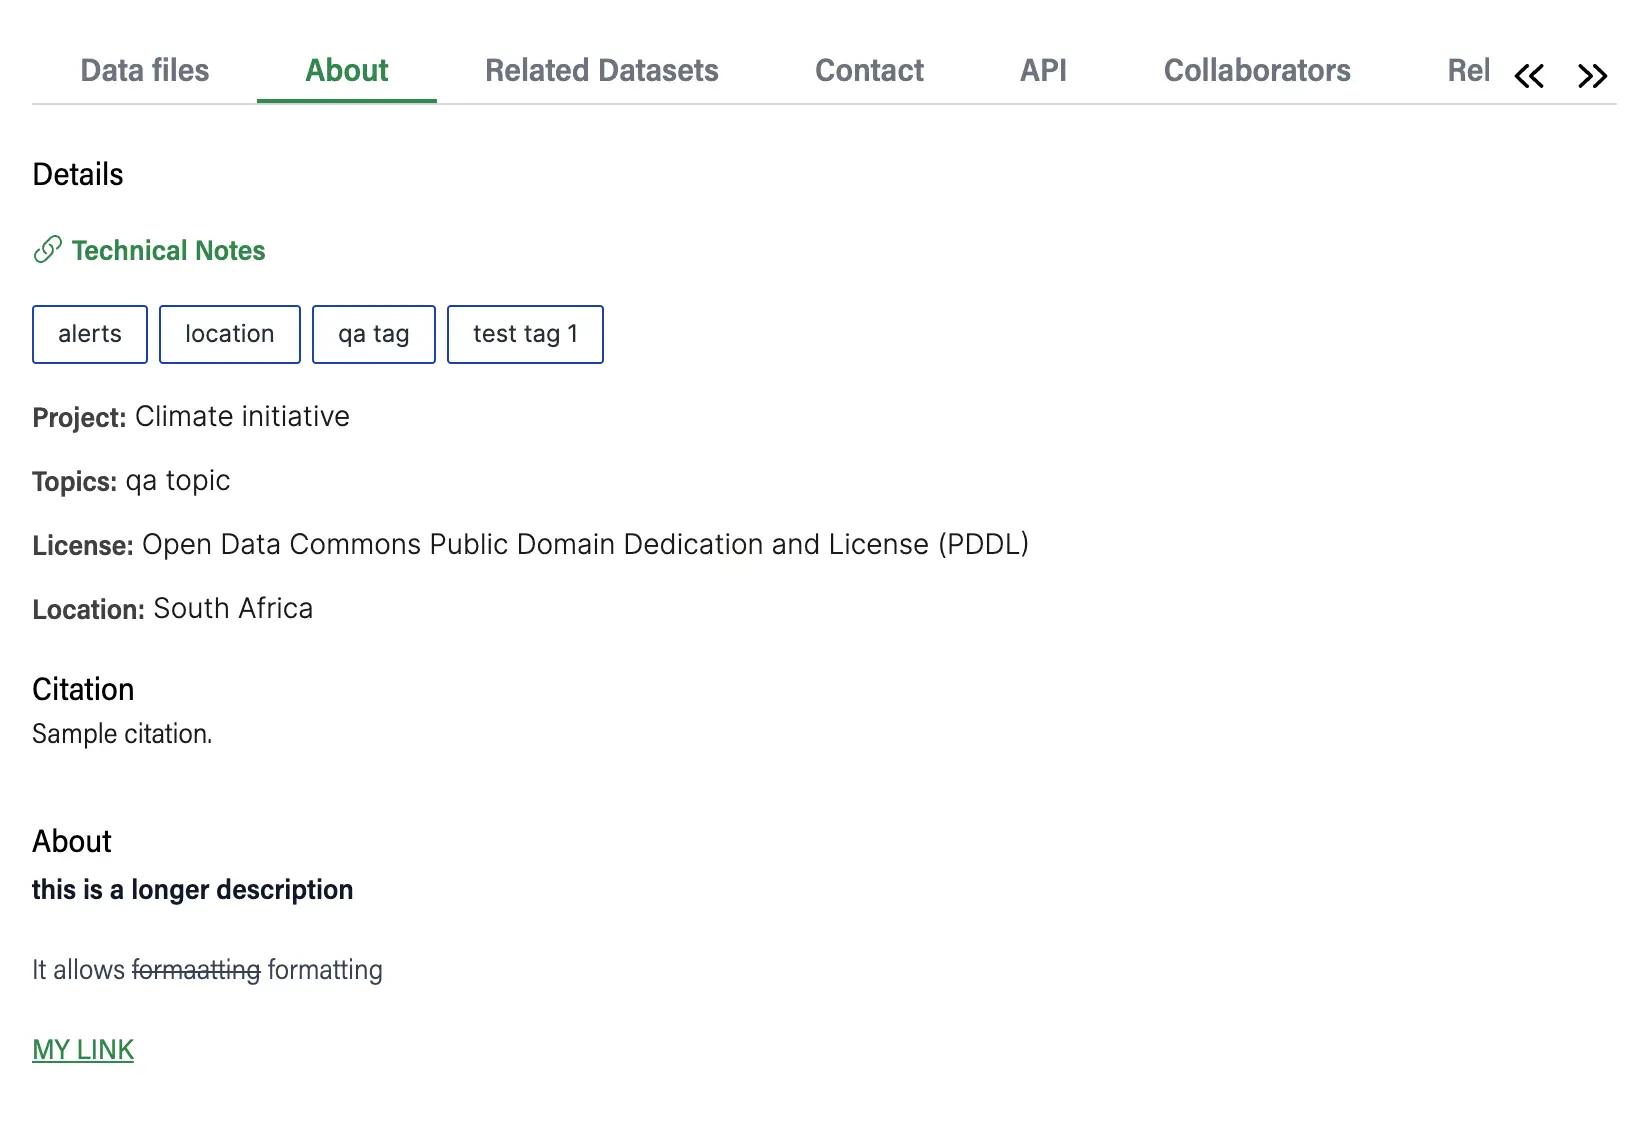
About tab
Contains additional metadata information about the Dataset, such as the description, Tags, licenses, citation etc.
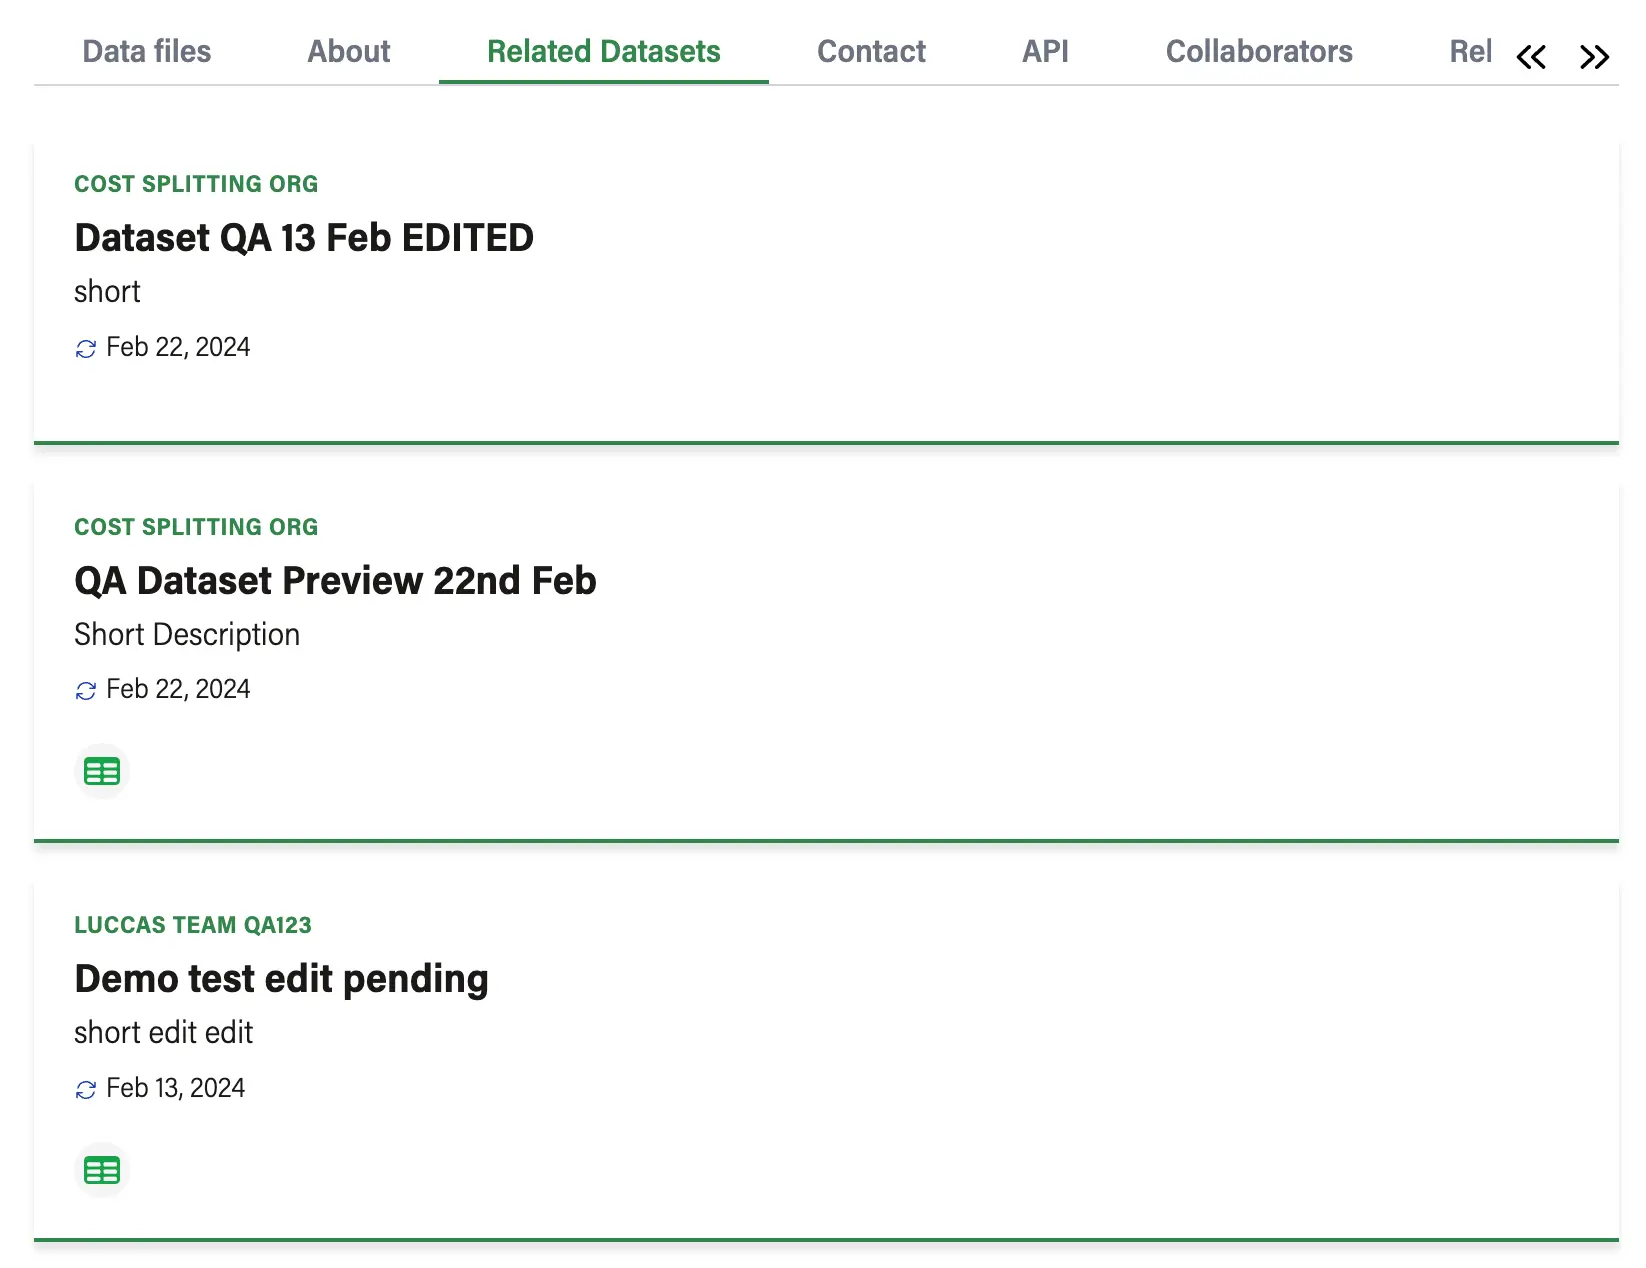
Related Datasets
Contain related Datasets, that is Datasets that belong to the same Topics
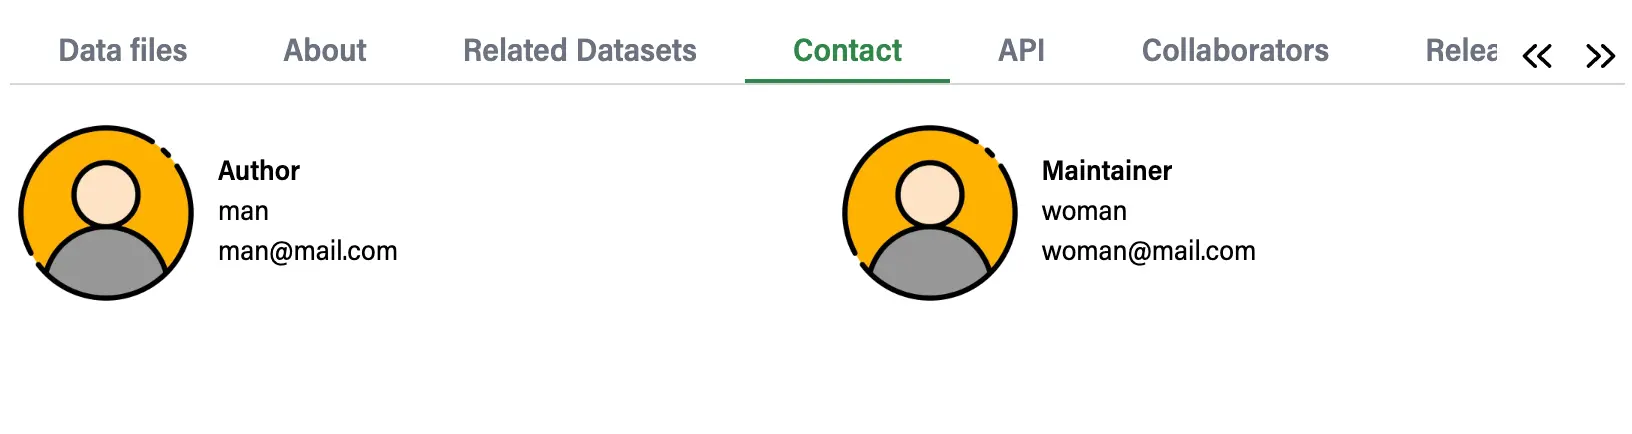
Contact Tab
Contains author and maintainer details
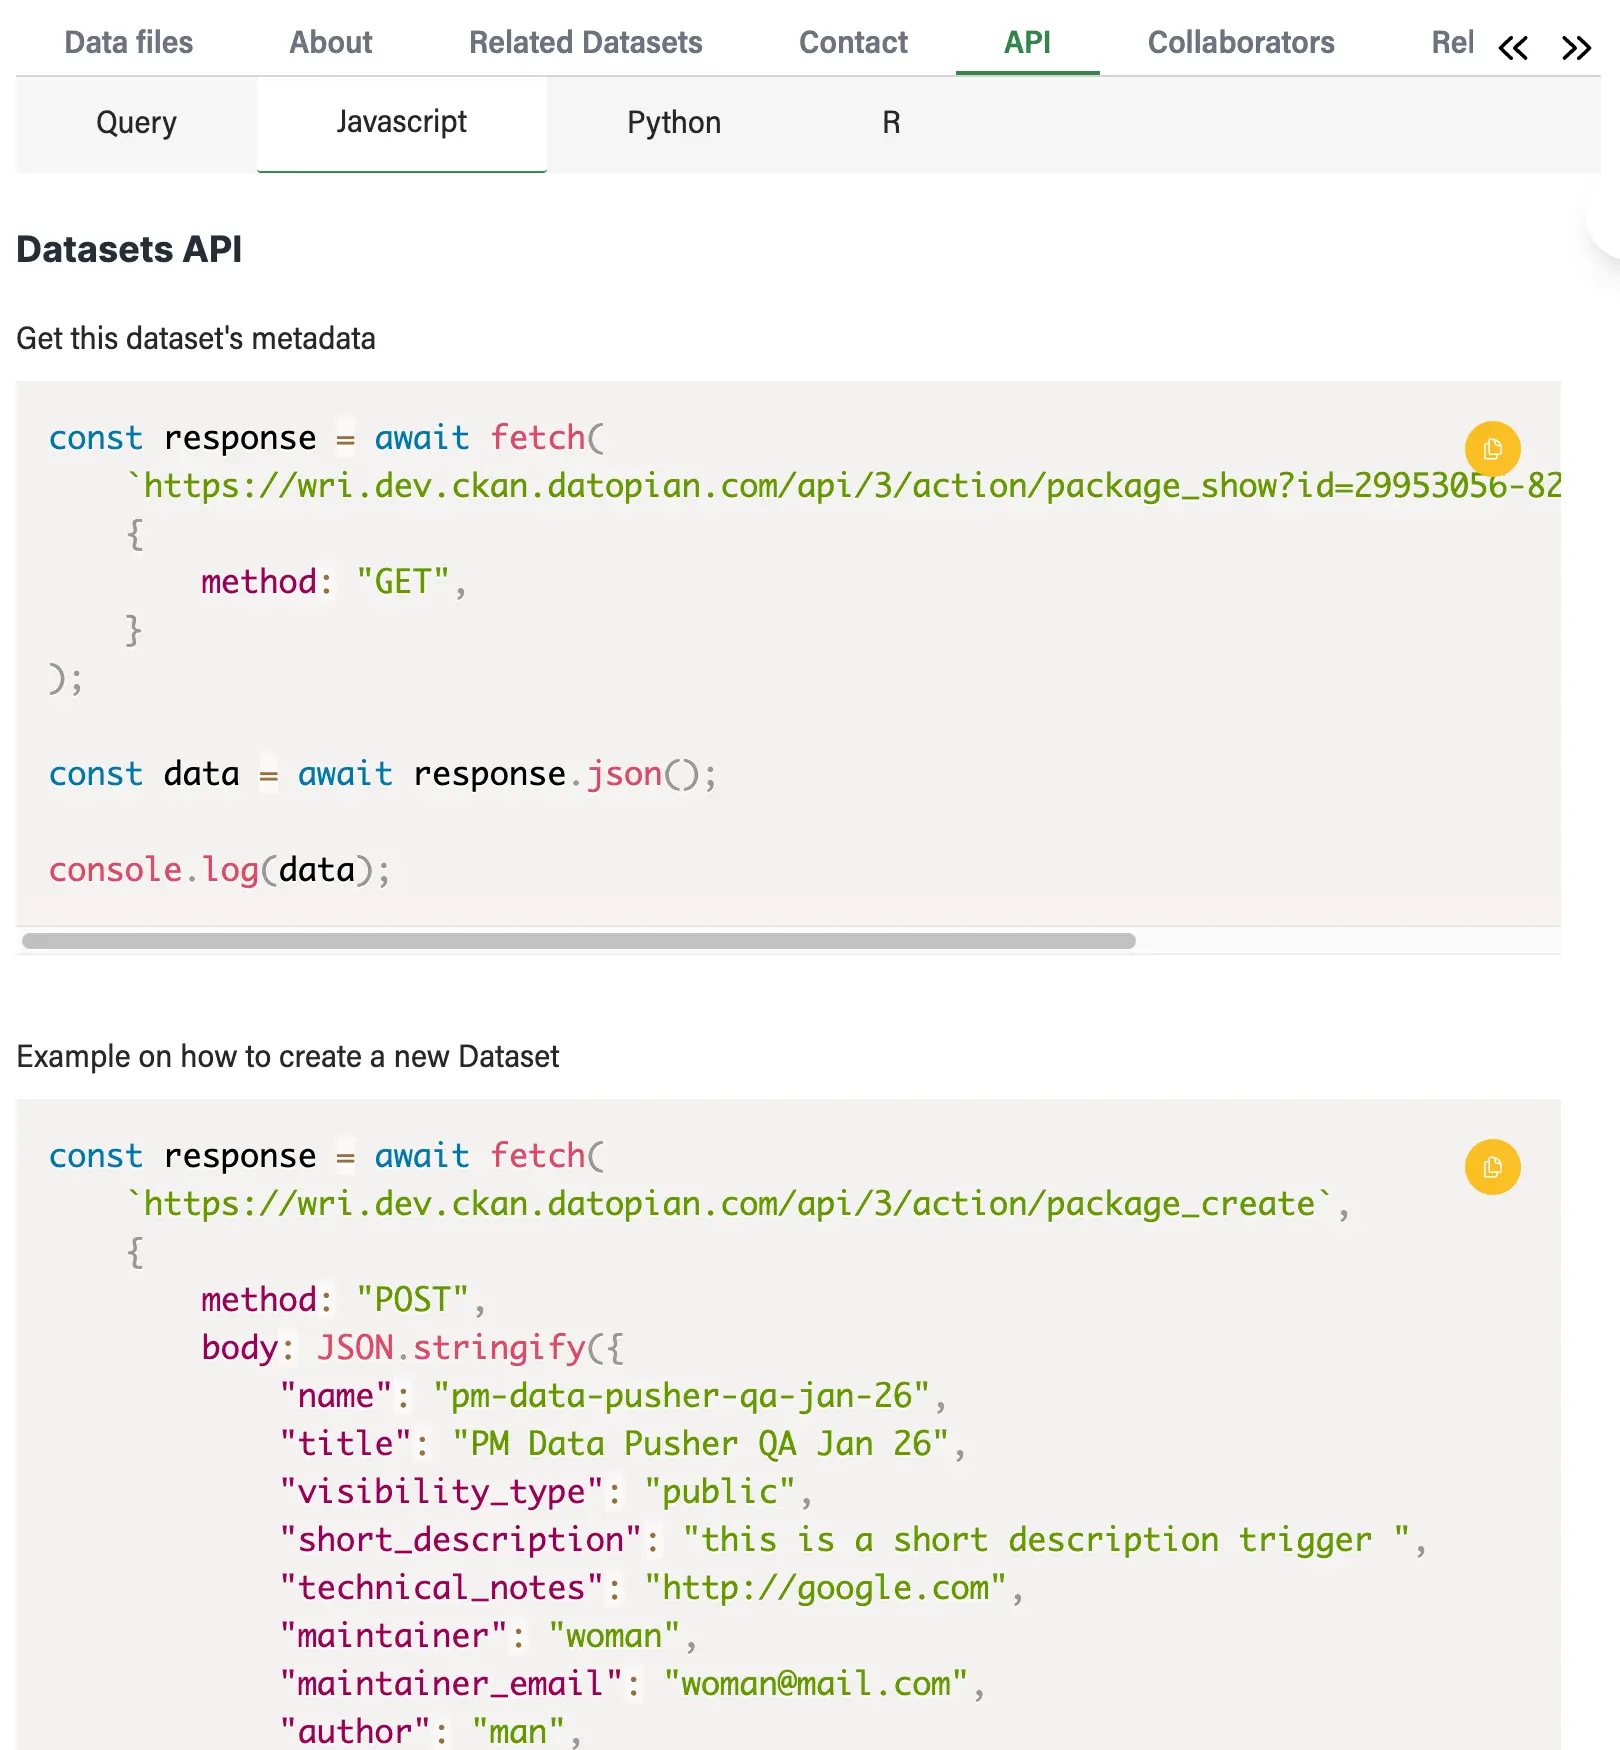
Api Tab
contains detailed information on how to use provided APIs across different programming language to create, edit, and view Datasets and Data Files
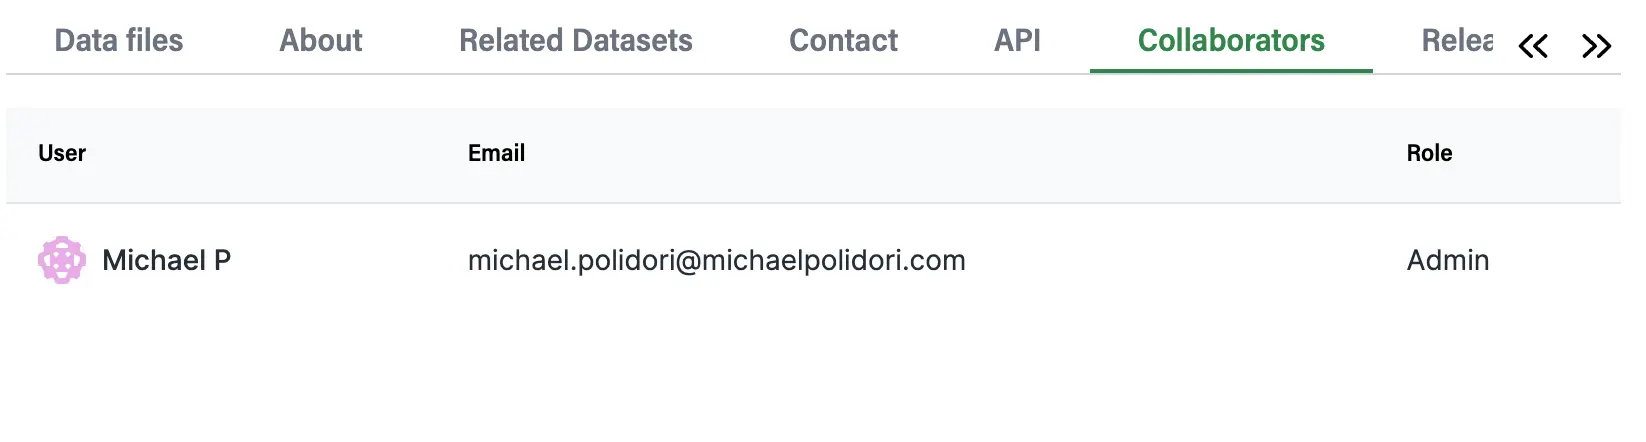
Collaborators Tab
Contains the list of collaborators on the Dataset
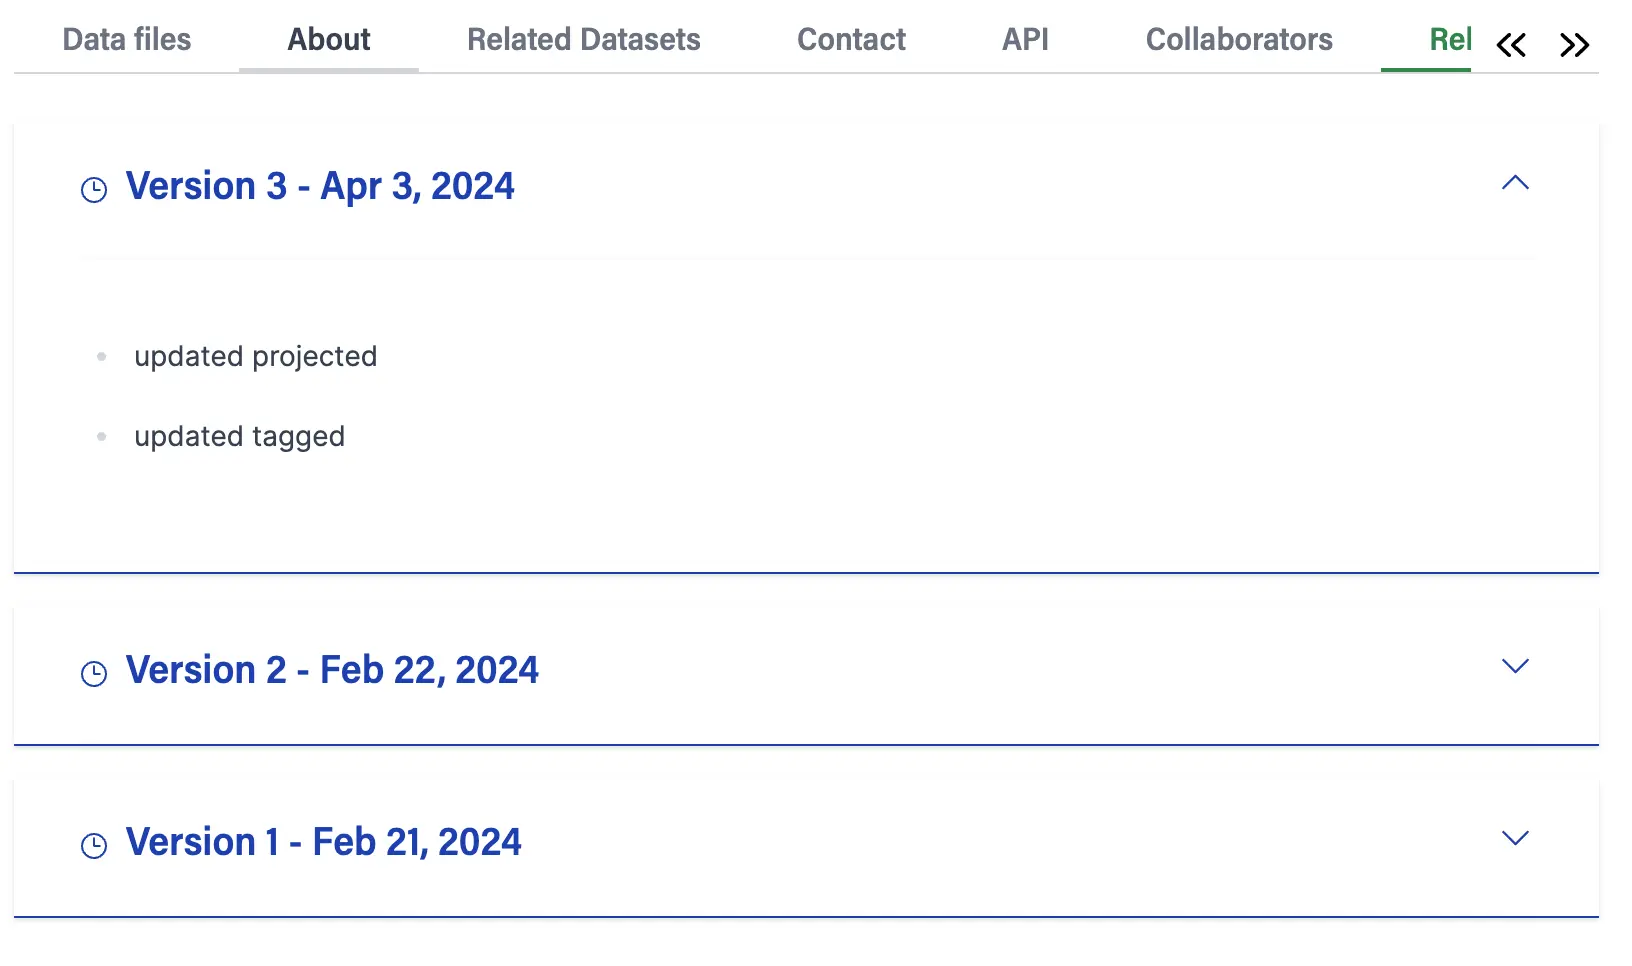
Release Note Tab
Release note are meant to be provided for every update the Dataset has undergone. this tab displayed all the released note